MicroStrategy ONE
Analyzing data in a table: Interactive Grid widgets
Data can be displayed in an interactive table as part of an Interactive Grid widget.
An example of an Interactive Grid widget is shown below:
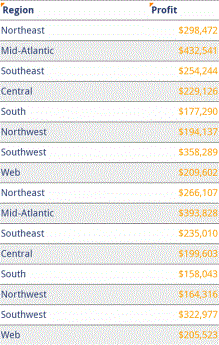
In this widget, attributes and metric values are displayed in the columns and rows, and grouping appears at the top of the screen. The widget above is grouped by Region.
Other ways to analyze data in a table may be enabled for your document, and include:
-
Tapping the metric to switch between metrics, if a report or document contains more than one metric.
-
Displaying different groups of data by tapping the Menu
 button at the top right corner of the screen, then tapping Page-By (for a report) or Grouping (for a document) and selecting the group of data that you want to display.
 -
If drilling is enabled for an object, the object is underlined. Drilling allows you to view data at different layers. Drill on an object by tapping it. For an example, see Viewing data at different levels using drilling.
-
Switch between displaying the widget in full screen and non-full screen mode by tapping the Enter full screen or Exit full screen button.