Strategy ONE
Document / dashboard best practice
Document or dashboard reusability with PRIME cube
Dashboards have replaced dataset functionality. This allows better reconciliation and reusability of dashboard definitions when switching between an OLAP and super cube.
By default, joins on unrelated attributes across datasets differ between documents and dashboards:
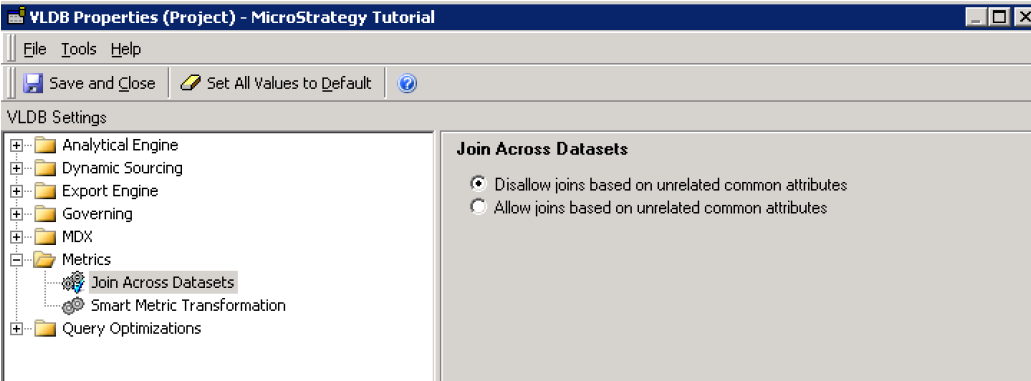
Documents follow a Project level setting
- In MicroStrategy Developer, right-click on the project and select Project Configuration…
- In the Project Configuration editor, expand Project definition, and choose Advanced.
- Under Project-Level VLDB settings, click Configure…
-
In the VLDB Properties dialog box, expand Metrics, and choose Join Across Datasets.
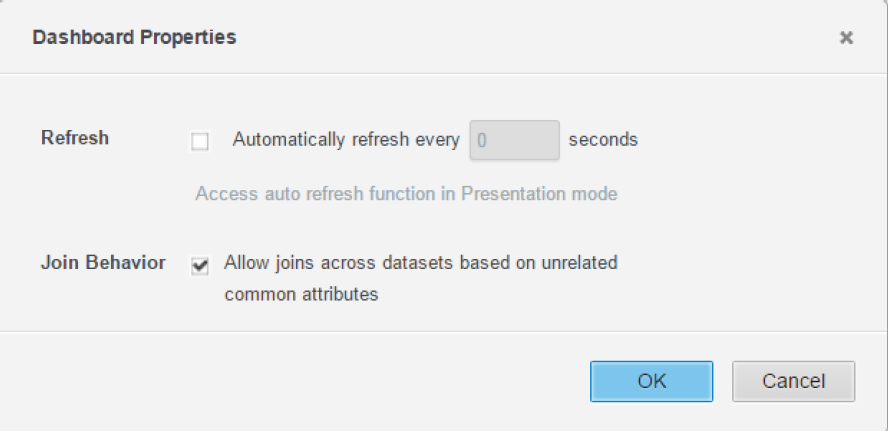
Dashboards have individual settings.
- In a MicroStrategy Web dashboard, from the File menu, choose Dashboard Properties.
-
Select/clear the Join Behavior option - Allow joins across datasets based on unrelated common attributes.
Relationships with Multi-Table Data Import
Generally, to increase the speed of aggregation and filtering, a one-to-many relationship is best.
In the MTDI workflow, auto relationship detection (using the first 1000 rows) can sometimes cause unnecessary overhead during cube publishing and introduce unwanted relationships. Be sure to check the relationships detected for each imported table to ensure that the relationships are not unwanted.
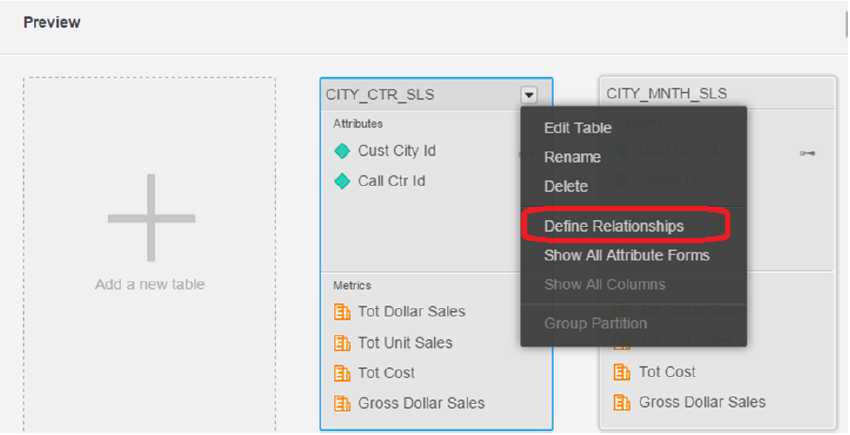
Relationships are global in nature. When defined on one table, they create a relationship table with composite information from all tables.
Metric guide
- Available under Function Parameters when Use Lookup for Attribute = False.
-
Some metrics can be calculated in multiple ways. This setting allows the designer to suggest which uploaded table should be considered for calculating a certain metric. In special circumstances, it can also help resolve performance issues introduced by what may be considered in-efficient joins.

- Row Count – #Imported Table Name# is the best way for a designer to control which table a particular metric gets evaluated from.
Use PRIME cube as dataset vs view report as dataset
- Working Set/View/Normal Reports, used as datasets in documents, currently cannot support multi pass analytics for document grids.
- Benefit of using View reports currently is allowing customers to drag and drop more default derived metrics into different dashboards that can be built and saved in view reports. We are looking to reduce that gap for Cubes. Another benefit is to be able to use a much smaller dataset by filtering data, which can be personalized by using prompts in View reports.
Derived metrics in View Reports would be aggregated two times: once from Cube to View Report and then from View Report to document grid.
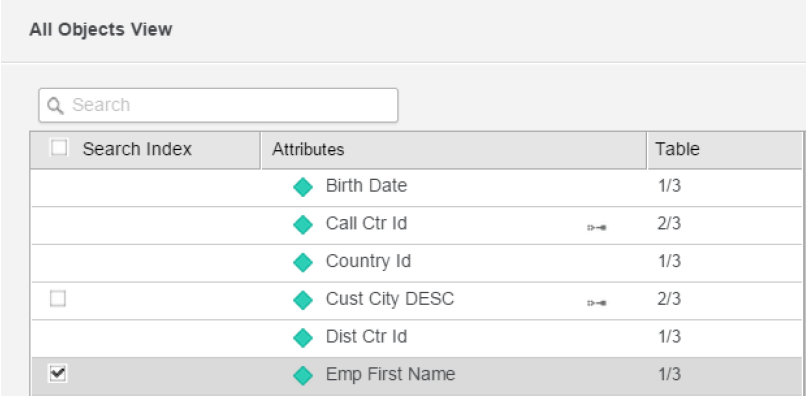
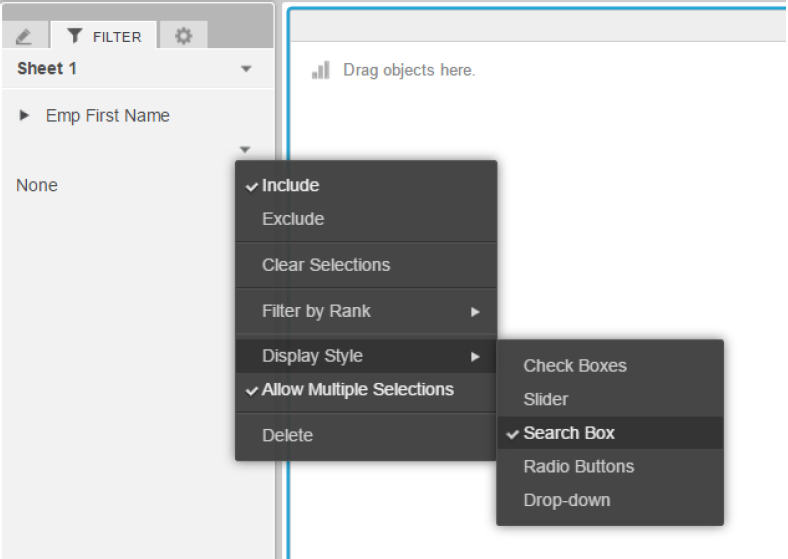
Super-fast search-style selectors
For super cubes, consider using Search Index to speed up Search Box style search on text fields. The Selector as Search Box is available in both documents and dashboards.