MicroStrategy ONE
Manually Formatting Graph Series and Objects
While you can apply broad formatting changes to your entire graph (as explained in Formatting a Graph Using Colors, Shading, and Effects), it is often convenient to manually format and fine-tune individual graph objects. For example, you can adjust colors, and apply a variety of graphical effects, including gradients, transparency, patterns, pictures, textures, and bevel effects to the objects.
To Manually Format Individual Graph Objects
- If the report is not already displayed as a graph, from the View menu, select Graph View to display the report as a graph.
- Right-click a graph object such as a riser, marker, graph frame, legend, and so on, and select Format name of object from the right-click menu. The Preferences dialog box opens.
This option is named based on the object you select. For example, for a line in a Line graph, this option is named Format Data Marker.
- You can use the following formatting categories to format graph objects:
The formatting categories Font, Line, Fill, Border, and Number Formatting are available depending on the graph object that is being formatted. For example, you cannot modify the font of a graph object which cannot hold any text. Also, the Number Formatting category is only shown if the graph object includes numeric characters.
- Font: Select this category to modify the text of a graph object. You can modify the font type, font size, font style, color, and text frame formatting.
- Line: Select this category to modify the formatting of a Line graph object. You can modify the line style, color, thickness, and transparency of the line.
This category may use a different name to reflect the type of line you are formatting such as Axis Line, Major Gridlines, Data Line, and so on.
- Border: Select this category to modify the formatting of a border graph object such as a frame or background border. This category provides the same line style, color, thickness, and transparency of the line options available for the Line category.
By default, all series in a graph share the same border formatting, which means that changing the border formatting for one series applies to all series for the graph. To define unique border formatting for each series in a graph, you must first select the general graph preferences option Allow different borders per series using MicroStrategy Developer. Once this option is selected and the changes are saved using MicroStrategy Developer, unique border formats for each series in a graph can then be applied and saved from either MicroStrategy Web or Developer.
- Number Formatting: Select this category to modify the numeric formatting of a graph object. Each numeric format type provides various formatting options to match the formatting for your numeric data. For information on the Number Formatting options and how to use them in graphs, see Formatting Numeric Values on a Graph.
- Fill: Select this category to modify the background effects of a graph object. You can modify the color, background effect type, bevel formatting, and transparency of the graph object. Some of these formatting options include:
When defining the Fill options for a series object of a graph, the options described below are ignored if the metric for the series has a metric-specific graph color. To apply the manual Fill options described below for a series object, you can disable the display of metric-specific graph colors by clearing the Apply metric formatting when available check box. Steps to perform this configuration are described in Formatting a Graph Using Colors, Shading, and Effects.
From the Background type drop-down list, select Gradient to apply a gradient. This type of background style displays a blended effect to gradually change from one color to a second color. For example, the image shown below displays a gradient that changes from a light yellow color to a dark green color.

- Use the Transparency slider to apply a transparency effect. The slider uses a range of zero to 100. A value of zero means the object is not transparent and thus appears as a solid object. Higher values make the object more transparent, which allows you to see objects behind the transparent object.
- Click Bevel to apply a bevel effect to the object's background. Bevel effects apply three-dimensional framing effects to the graph object.
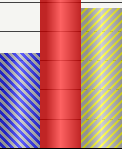
- From the Background type drop-down list, select Pattern to apply a pattern to the object's background. Patterns can help to distinguish between different series risers in a graph without having to rely solely on color. For example, the three bar risers shown below can be distinguished by color as well as by the pattern they use.
- From the Background type drop-down list, select Picture to apply a picture to the object's background. Pictures can be applied to graph frames or backgrounds to apply a standard company background style or watermark to all graphs.
- From the Background type drop-down list, select Texture to apply a texture to the object's background. Textures can help to distinguish between different series risers in a graph without having to rely solely on color. However, the formatting applied for each texture can be drastically different from other textures. For this reason it is important to make sure the textures you apply to your graph objects are visually appealing when displayed on the same graph.
- Click Apply.
- Click OK.