MicroStrategy ONE
Compound Metric Example
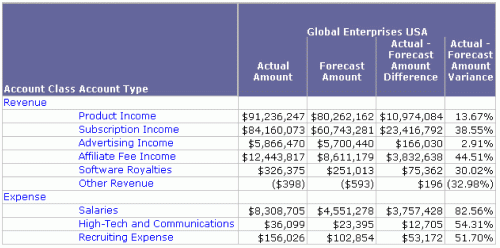
The following report compares actual amounts to forecasted amounts. It is used to assess differences between projected amounts, referred to as forecasts, and the actual amounts for the selected time period. This report sample presents only a subset of the entire report, as it is a long report.

The first two metrics, Actual Amount and Forecast Amount, are simple metrics. The Actual Amount is the sum of the fact Account Amount, which is the dollar value of all the accounts. The Forecast Amount is the sum of the fact Account Forecast Amount, which is a calculated value generally assigned to the accounts quarterly and usually adjusted monthly. These definitions are shown below:
Sum([Account Amount]) {~+}
Sum([Account Forecast Amount]) {~+}
The {~+} indicates that the metrics are calculated at the report level; for an explanation of how the report level affects metric calculation, see Report Level: Interaction with the Context of Reports. See the table of symbols in Metric Level Symbols: Defining Expression Syntax.
The last two metrics on the report are compound metrics based on these simple metrics. The metric definition for Actual - Forecast Amount Difference simply subtracts Forecast Amount from Actual Amount, as shown below:
([Actual Amount] - [Forecast Amount])
The Actual - Forecast Amount Variance metric determines the ratio of the difference to the forecast amount, as shown below:
((1.00001 * ([Actual Amount] - [Forecast Amount])) / (1.00001 * [Forecast Amount]))
Notice the lack of symbols for levels, conditions, or transformations in the formulas of the compound metrics. If this information were present, it would come from the simple metrics. In this case, the compound metrics are calculated at the report level.
