Strategy ONE
Debugging using Eclipse
This topic illustrates how to debug using Eclipse. In the instructions below, Eclipse SDK 3.3.1.1 is the version that is referenced throughout the instructions for illustrative purposes.
See the MicroStrategy SDK Readme for the certified/supported versions of the Eclipse SDK under the Certified and Supported Configurations section. The default locations for the MicroStrategy SDK Readme files are:
-
Windows: C:\Program Files\Common Files\MicroStrategy\ReleaseNotes\ReadMe_SDK_2.htm
You can also access this file fromStart -> Programs -> MicroStrategy Documentation -> ReadMe. -
UNIX: /opt/MicroStrategy/ReleaseNotes/ReadMe_SDK_2.htm
The following steps guide you in debugging using Eclipse.
-
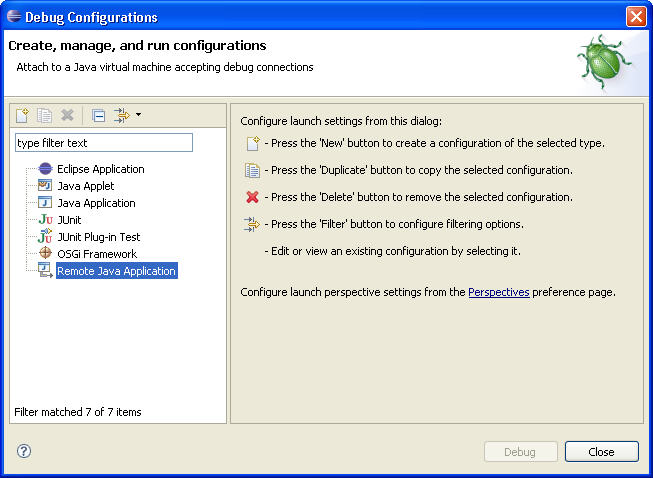
Right-click Web_Mstr and select Debug As->Debug Configurations. The following Debug Configurations dialog box is displayed.
-
In the tree control on the left-hand side of the dialog box, right-click the Remote Java Application item and choose New. This creates a new remote debugging configuration Web_Mstr associated with the current project.
-
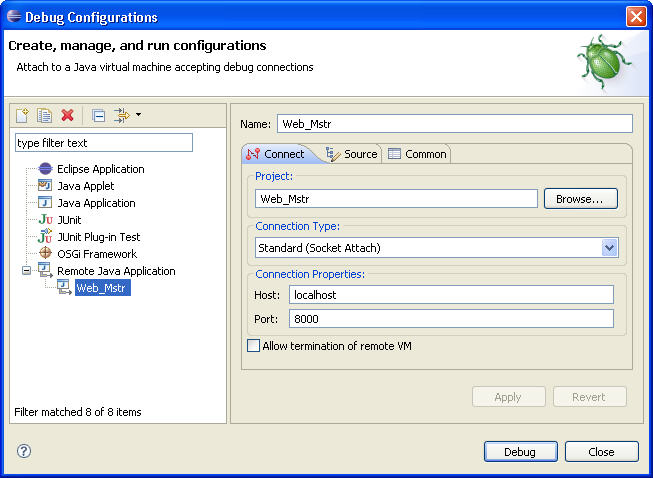
Configure the remote debugging configuration, Web_Mstr, as follows:
-
In the Connection Type drop-down menu, select Standard (Socket Attach) as the connection type.
-
In the Host text field in the Connection Properties section, specify the host to connect to. This should be the name or IP address of the Web server machine. You can use localhost if the development and Web server machines are the same.
-
In the Port text field in the Connection Properties section, specify the port number used in the Prerequisite Steps for Setting Up the Debugging Environment topic.
-
-
Click the Debug button. This starts a debugging session with the remote JVM that allows you to set breakpoints and step through source code. To use Eclipse’s Hot Code Replace feature, make sure that the code to be debugged is not packaged as an archive.