Strategy One
Create a Histogram
- Open a dashboard.
-
In the top toolbar, click .
- Choose More > Histogram
 .
. - In the Datasets panel, double-click attributes and metrics to add them to the visualization. A histogram requires at least one attribute and one metric.
- Open the Format panel to modify formatting options, specific to histograms.
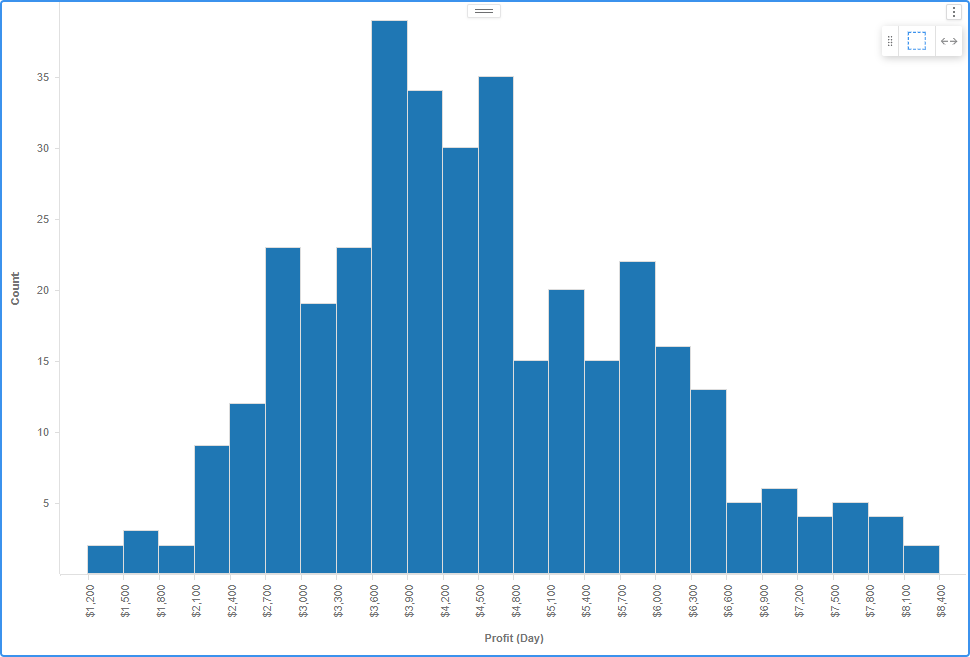
Histogram Example