Strategy One
Create a Grid
You can create a grid in a dashboard.
- Open a dashboard.
-
In the top toolbar, click .
- Choose Grid > Grid
 .
. - In the Datasets panel, double-click attributes and metrics to add them to the visualization. A grid requires at least one attribute and one metric.
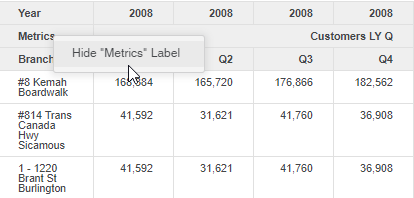
- In some situations, a Metrics header is automatically generated. You can hide or show the text in this header, by right-clicking it and choosing Hide/Show "Metrics" Label.