Strategy One
Create a Compound Grid
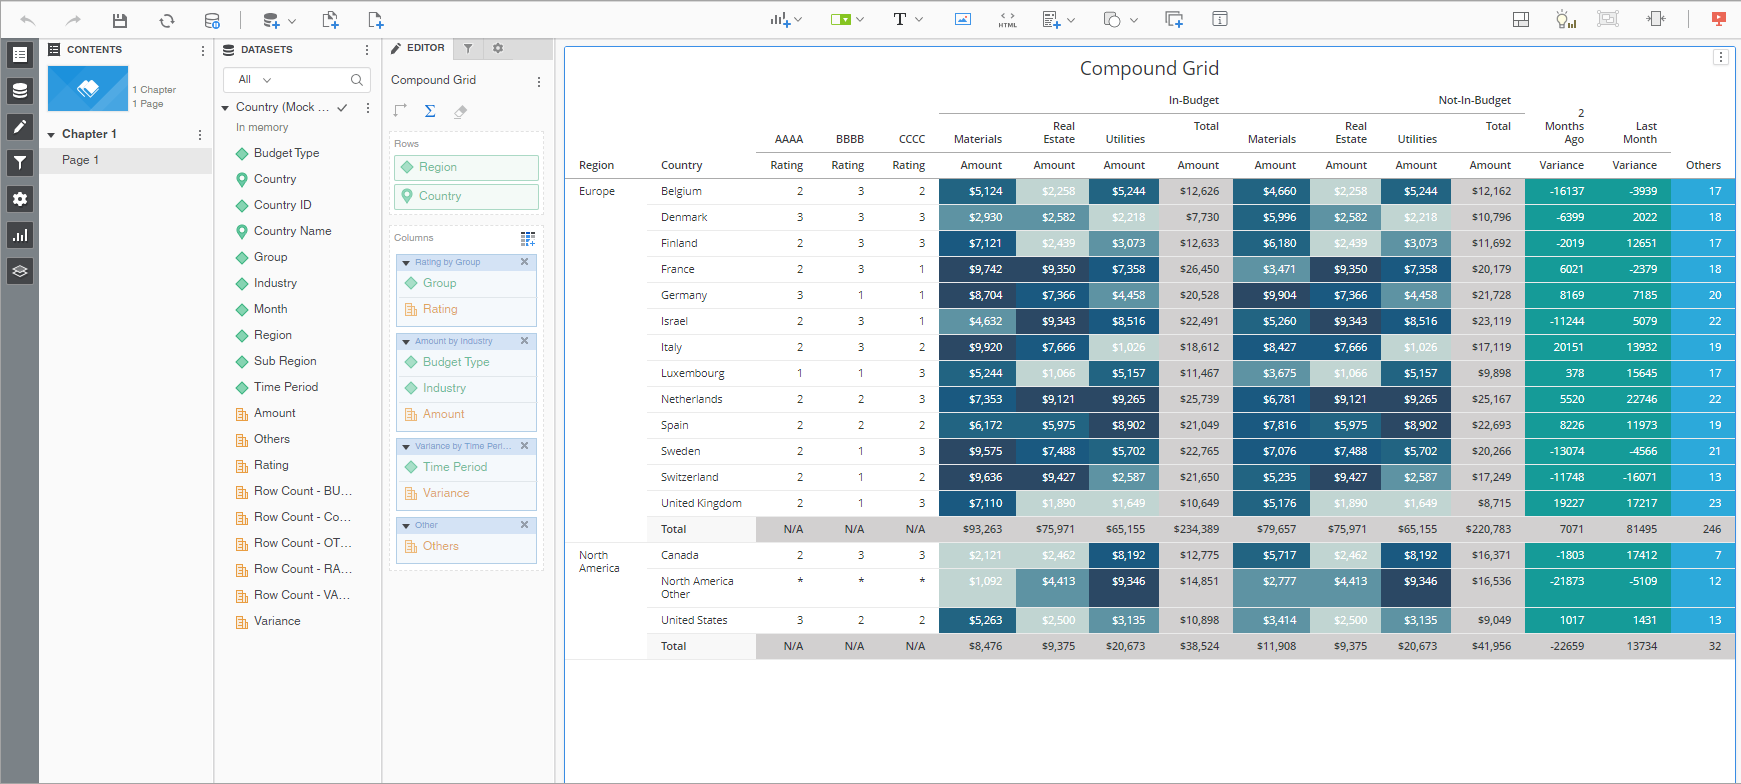
A compound grid is a visualization that allows you to build complex grids that analyze different aspects of data across a common dimension. This means you can have multiple unrelated attributes and metrics in different sets of columns that are then stitched together in one grid. Each column set can appear differently as thresholds, advanced filters, and formatting can be applied to each set.
- Open a dashboard.
-
In the top toolbar, click

- Choose Grid then Compound Grid
 .
. - In the Datasets panel, double-click attributes and metrics to add them to the visualization. A compound grid requires at least one attribute and one metric. Attributes are automatically displayed in the rows and metrics in Column Set 1.
- To add an attribute to the column set, drag it from the Datasets panel to the Column Set 1 drop zone in the Editor panel.
- To create another column set, in the Editor panel, click Add Column Set
 . Add attributes and metrics to the new column set.
 - To rename a column set, double-click the name in the Editor panel and type the new name.
- To add an advanced filter for a specific column set, click More
 in the upper right corner of the visualization and choose Edit Filter. Select a column set and click Add New Qualification. See Manage Qualifications for an Advanced Filter for information on adding qualifications.
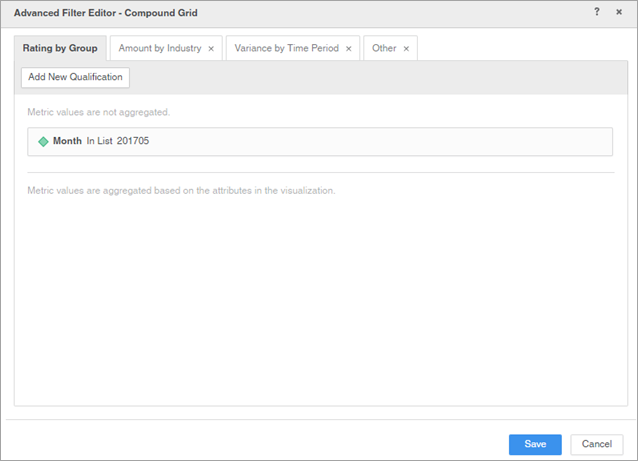
- In the Format panel, select formatting options for a specific column set by choosing Column Headers or Values in the first drop-down list. Then, choose the column set from the second drop-down list.
Related Topics
KB483841: Known issues when using a slicing selector to target a Compound Grid visualization