Strategy ONE
Enable Custom Selection and Highlighting
You can achieve highlighting effects by using third-party plotting libraries such as D3.js. The Custom Selection and Highlight API enables the selection status of the graphics to persist when reopening a saved dashboard, as well as when using the custom visualization as a selector or target when filtering another visualization.
Implement the sections below in the following order to enable this feature:
If you are not using the Custom Visualization Tool to build the common structure of your custom visualization, add the following lines of code to include the classes required for enabling custom selection and highlighting.
mstrmojo.requiresCls(
    "mstrmojo.CustomVisBase",
    "mstrmojo.models.template.DataInterface",
    "mstrmojo.array",
    "mstrmojo.customviz.GraphicModel",
    "mstrmojo.customviz.CustomVisEnums"
);
Create Graphic Models
To enable selection, first build the graphic models using createGraphicModels.
API Name
createGraphicModels: Use this API to create model data for each graphic that appears in the visualization.
Parameters
N/A
Implementation
-
Call functions in class DataInterface to get model data of the visualization.
-
Create a set to hold graphic models. This can be defined as a tree/array or any structure you want.
-
Create a graphic model for each graphic to be displayed on the visualization and add it to the set defined in step 2, then return the set.
The graphicModels variable is defined by the SDK user. It contains the definition of the inner structures of the set of graphic models. Therefore, to enable selection and highlight when the custom visualization is used as the target (using the Select Target context menu), SDK users must implement an iterative process to check all graphic models in graphicModels. Use the iterative process to decide if a single graphic model within graphicModels should be chosen by a selector pass from the source visualization. All selected graphic models in the custom visualization are passed to the MicroStrategy framework to determine which graphics to select and highlight after a refresh or other action.
You can retrieve the definition of the inner structures of the set of graphic models by calling the getGraphicModels@customVisBase function.
CopycreateGraphicModels: function createGraphicModels() {
var me = this;
// Object to store your desired dataset structure
var graphicModels = { children: [] };
var rawData = this.dataInterface.getRawData(mstrmojo.models.template.DataInterface.ENUM_RAW_DATA_FORMAT.ROWS_ADV, {
hasSelection: true,
hasTitleName: true
});
$ARR.forEach(rawData, function (row) {
var headers = row.headers;
var values = row.values;
var value = values[0];
var graphicModel = new GraphicModel();
// Set properties to the graphic model.
graphicModel.setCustomProperties({
packageName: headers[0].name,
className: headers[1].name,
value: value.rv,
formattedValue: value.v
});
// Set the selector of the graphic
var isAttributeSelector = false;
graphicModel.setSelector(row.metricSelector, isAttributeSelector);
// Add the graphic model to the a custom set which you defined on your own.
graphicModels.children.push(graphicModel);
});
// Return the set of graphic models you defined
return graphicModels;
},
Bind Graphic Models to Graphics
Once you build the graphic models, you must bind them to the graphic using getGraphicModels.
API Name
getGraphicModels: Call this function to retrieve the set of graphic models created in the createGraphicModels API.
Parameters
N/A
Usage
It is recommended to call this function within the plot()function.
-
Retrieve the set of graphic models.
-
Iterate through each graphic model in the set and bind it to the corresponding graphic.
The method of binding a graphic model to a graphic is defined by the SDK user or by the 3rd-party plotting libraries if any are used.
Copy
plot: function () {
    // Sample code of initializing bubbles using the D3.js plotting library.
    // Render parent SVG tag in domNode, if not yet rendered
    var svg = d3
        .select(this.domNode)
        .select("svg");
    if (svg.empty()) {
        svg = d3
            .select(this.domNode)
            .append("svg")
            .attr("class", "bubble");
    }
    svg.attr("width", width)
        .attr("height", height)
        .on('click', function () {
            // Custom callback to handle click on empty space - e.g to clear selections
            handleClickOnEmpty(viz);
        });
    var g = svg.select("g");
    if (g.empty()) {
        g = svg.append("g");
    }
    g.attr("transform", "translate(" + (width - diameter) / 2 + "," + (height - diameter) / 2 + ")");
    // Get the graphic models.
    var graphicModels = this.getGraphicModels();
    //Bind the graphic models to the graphic.
    var node = g.selectAll(".node")
        .data(bubble.nodes(graphicModels)
            .filter(function (d) {
                return !d.children;
            }));
    //...
}
Enable Selection
To enable selection two APIs need to be called—handleSelection() and handleContextMenuSelection(). These APIs notify the framework of a selection or context menu selection change.
API Name
handleSelection: Call this function to notify the framework of a click on a graphic and let the framework handle the selection change.
Parameters
graphicModel: The graphic model bound to the graphic.
isMultiSelectMode: If the user is making multiple selections set to true. Otherwise, set to false.
Usage
-
Listen to the mouse-click (desktop) or tap (mobile device) on a graphic.
-
Get the graphic model which is bound to this graphic as the first parameter.
-
Check the key status to see if the Ctrl key (Command on Mac) is down to indicate multi-selection.
- If down, set isMultiSelectMode to true
- If else, set isMultiSelectMode to false.
-
Pass the result in step 2 and step 3 as the parameter to call the function.
Copyonclick: function onclick(evt) {
if (evt.e) {
evt = evt.e;
}
var srcNode = evt.srcElement;
//Get graphic model bind to the graphic.
var graphicModel = d3.select(srcNode).datum();
var isMultiSelectMode = evt.ctrlKey || evt.metaKey;
this.handleSelection(graphicModel, isMultiSelectMode);
},
API Name
handleContextMenuSelection: Call this function to notify the framework of right-click on a graphic and let the framework handle the context menu selection change.
Parameters
graphicModel: The graphic model bound to the graphic.
Usage
- Listen to the right-mouse-click (desktop) or long tap (mobile device) on a graphic.
- Get the graphic model which is bound to this graphic as the parameter.
-
Pass the parameter to call the function.
Copyoncontextmenu: function oncontextmenu(evt) {
if (evt.e) {
evt = evt.e;
}
var srcNode = evt.srcElement;
//Get graphic model bind to the graphic.
var graphicModel = d3.select(srcNode).datum();
this.handleContextMenuSelection(graphicModel);
},
Enable Highlight
Two APIs need to be implemented to enable highlight—getGraphicModelsBySelector for the selected graphics and updateHighlight to define the highlight style.
API Name
getGraphicModelsBySelector: API to pick out the graphic models by the given selector.
Parameters
selector: The selector to select graphics models.
isAttrSelector: Whether the selector is an attribute selector.
Member Function
canPickGraphicModel: Use this function to check whether the graphic model should be picked by the given selector. If the graphic model is picked it will be highlighted when the custom visualization is the target and a selection is made in the source visualization being used as a filter.
Parameters
selector: The selector to check.
isAttrSelector: Whether the selector is an attribute selector.
graphicModel: The graphic model to check.
pickOptions: The criteria to match the graphic model and given selector. This parameter is optional, if you do not want to define a distinctive behavior, just pass this parameter as null.
Usage
-
Pass a selector as the first parameter.
-
If the selector is an attribute selector, set the second parameter true, otherwise set it false.
-
Pass the graphic model as the third parameter to check if it should be picked by the selector given.
-
Define the options for picking the graphic model. Refer to the section Pick Options for detail.
Implementation
- Get the graphic models by calling the member API getGraphicModels.
-
Iterate through all graphic models and call the member function canPickGraphicModel to check if the graphic model should be picked by the selector.
-
Return all graphic models picked by the given selector.
CopygetGraphicModelsBySelector: function getGraphicModelsBySelector(selector, isAttrSelector) {
var viz = this;
var ret = [];
//Get the set of graphic models.
var graphicModels = this.getGraphicModels();
//Define the rules for picking the graphic models.
var pickOptions = {
attribute: mstrmojo.customviz.PICKED_TYPE.METRIC,
metric: mstrmojo.customviz.PICKED_TYPE.METRIC,
criteria: mstrmojo.customviz.PICKED_CRITERIA.INTERSECTION
};
//Iterate through the set.
mstrmojo.array.forEach(graphicModels.children, function (graphicModel) {
//Check if the graphic model should be picked
if (viz.canPickGraphicModel(selector, isAttrSelector, pickOptions, graphicModel)) {
ret.push(graphicModel);
}
});
// Return all the graphic models picked by the given selector.
return ret;
},
API Name
updateHighlight: API to define your own style of highlight.
Parameters
N/A
Member Function
graphicNeedsHighlight: Call this function to check whether the graphic should be highlighted in the style of selection/context menu selection or not.
Parameters
graphicModel: The graphic model to check.
forContextMenu: To check whether the graphic is in selection for context menu selection or not.
Usage
- Pass a selector as the first parameter.
- To check whether the graphic is in selection, set the second parameter to false, to check whether the graphic is in selection of context menu, set it to true.
- You can use this function to check whether the graphic needs to be highlighted and what kind of highlight is needed in the API updateHighlight.
Implementation
-
Iterate through all graphics on the visualization, and get the corresponding graphic models.
-
Call the function graphicNeedsHighlight in the previous table to check whether the graphic should be highlighted in the style of selection/ context menu selection or not.
-
Realize the style of highlight in each case.
CopyupdateHighlight: function updateHighlight() {
var viz = this;
//highlight effect for selection
d3.select(this.domNode)
.selectAll(".node")
.select(".outer")
.style("stroke", "black")
.style("stroke-width", function (graphicModel) {
// If the graphic should be highlighted as a style for selection, set the border of the bubble to black and 2 pixels in width
return viz.graphicNeedsHighlight(graphicModel, false) ? '2px' : '0px';
});
d3.select(this.domNode)
.selectAll(".node")
.select(".inner")
.style("stroke", "white")
.style("stroke-width", function (graphicModel) {
// If the graphic should be highlighted as a style for context menu selection, set the border of the bubble to white and 2 pixels in width
return viz.graphicNeedsHighlight(graphicModel, true) ? '2px' : '0px';
});
},
Pick Options
When a custom visualization is the target of a visualization as a filter and highlight mode is selected, the corresponding graphics need to be highlighted when a selection is made in the source visualization. The pick options are used to define the highlighting behavior of the target custom visualization after making a selection in the source visualization.
The pick options have three parameters: attribute, metric, and criteria.
Defines the projection from the header in the source visualization to the graphics in the target custom visualization.
It can be set to one of the following constants:
- mstrmojo.customviz.PICKED_TYPE.ATTR
-
mstrmojo.customviz.PICKED_TYPE.METRIC
-
mstrmojo.customviz.PICKED_TYPE.BOTH
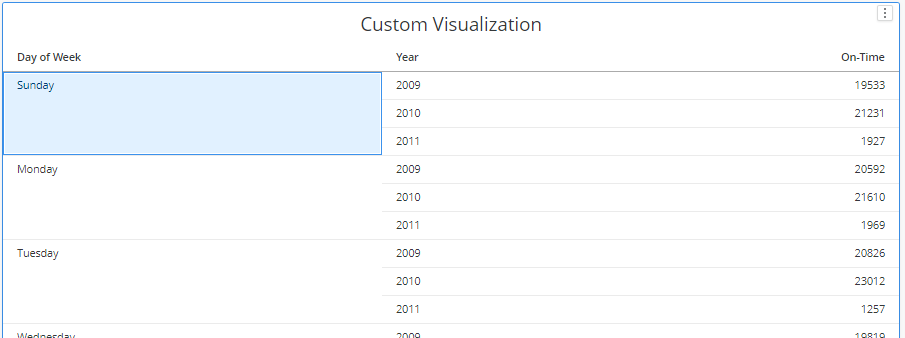
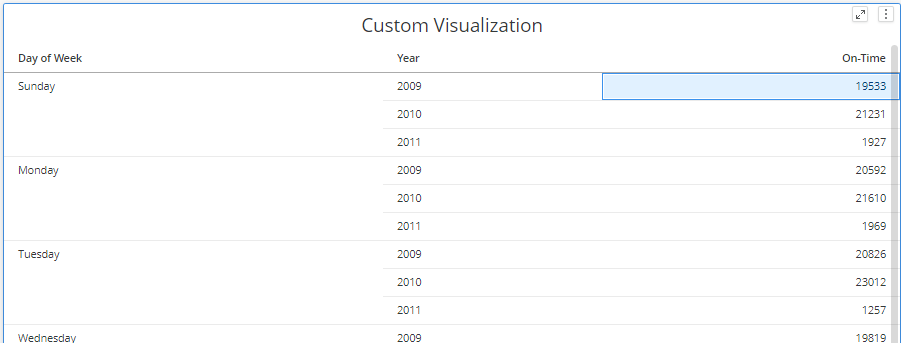
mstrmojo.customviz.PICKED_TYPE.ATTR means if we select headers in the source visualization, the graphics which represent headers with the same values will be picked and highlighted.
For example, if a row header with value Sunday is selected in the source visualization, the graphic in the graphic model that is also an attribute selector with the value of Sunday is picked and selected.
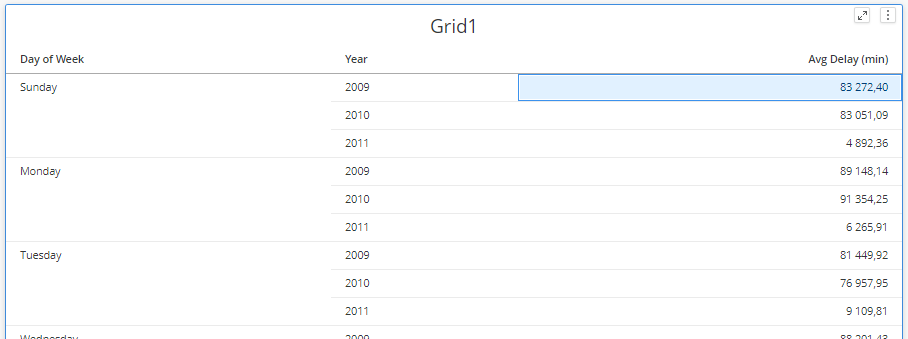
Source
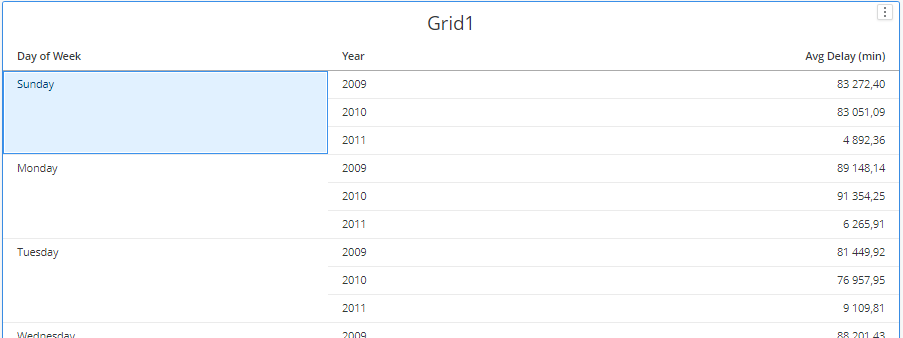
Target
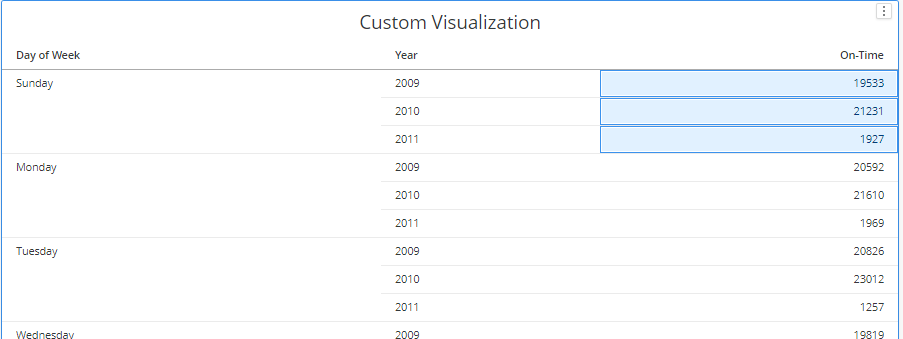
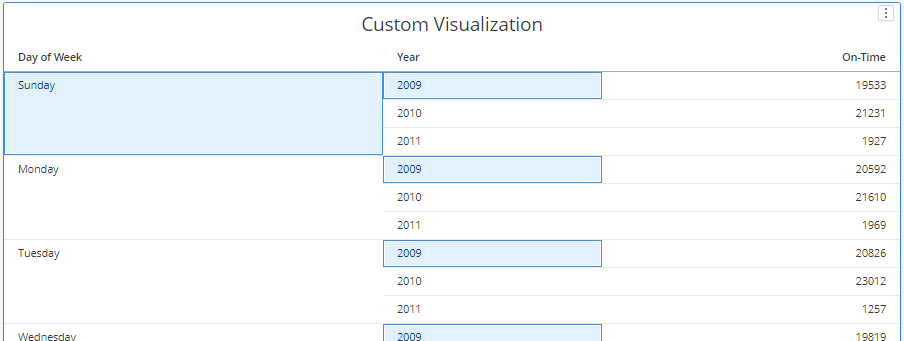
mstrmojo.customviz.PICKED_TYPE.METRIC means if we select headers in the source visualization, the graphics which represent data points which contain the headers with same values will be picked and highlighted.
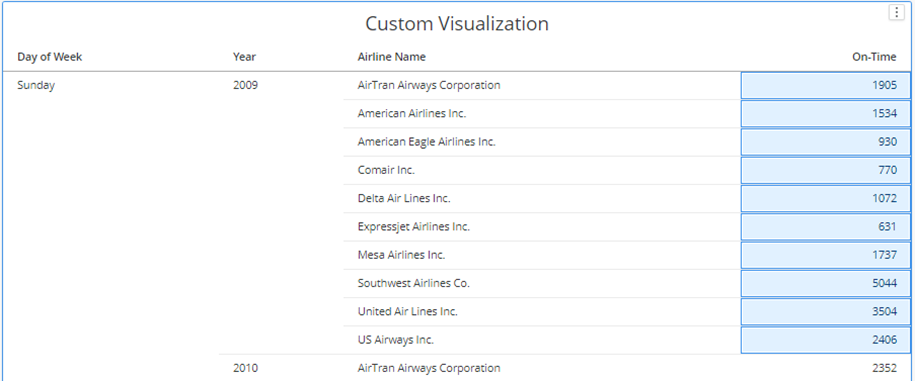
For example, if we select a row header with value of Sunday in the source visualization, the graphics whose selectors in the graphic models are metric selectors that contain a header with the value of Sunday are picked and selected.
Source
Target
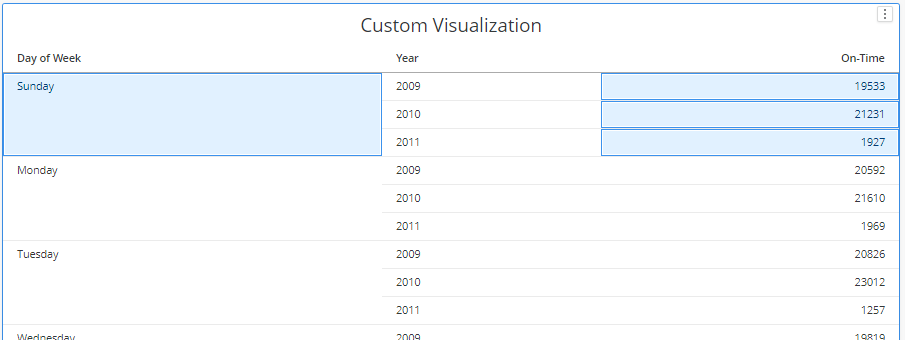
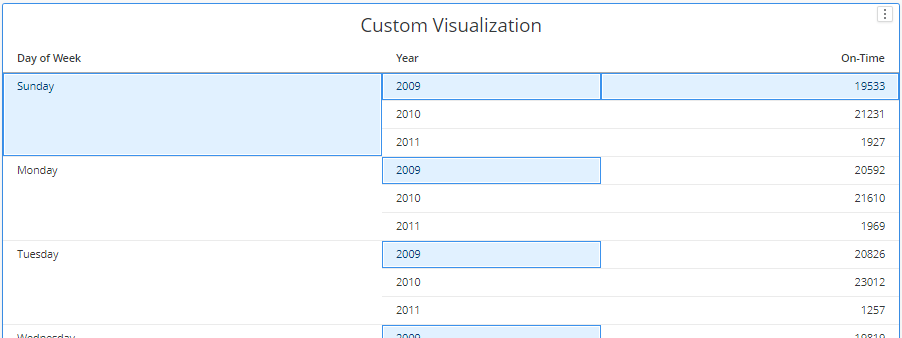
mstrmojo.customviz.PICKED_TYPE.BOTH means if we select headers in the source visualization, both the graphics which represent the headers and the data point with the same values will be picked and highlighted.
The picked graphics are a union of the graphics picked by mstrmojo.customviz.PICKED_TYPE.ATTR and mstrmojo.customviz.PICKED_TYPE.METRIC.
Source
Target
Defines the projection from data points in the source visualization to the graphics in the target custom visualization.
It can be set to the following constants:
- mstrmojo.customviz.PICKED_TYPE.ATTR
-
mstrmojo.customviz.PICKED_TYPE.METRIC
-
mstrmojo.customviz.PICKED_TYPE.BOTH
mstrmojo.customviz.PICKED_TYPE.ATTR means if we select data points in the source visualization,we will pick and highlight any graphic in the target visualization whose selector is an attribute selector which is among the headers of the data points selected on source visualization and the values of the two headers are equal.
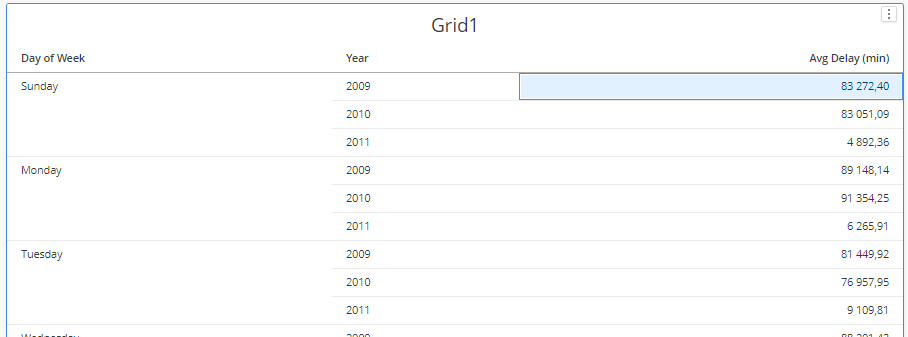
For example, if we select the data point representing the average delay on Sundays in year 2009 in the source visualization, the graphics that represent the header value Sunday and 2009 are picked and highlighted in the target visualization.
Source
Target
mstrmojo.customviz.PICKED_TYPE.METRIC means if we select headers in the source visualization, the graphics which represent a data point with the same header values will be picked and highlighted in the target visualization.
For example, if we select the data point representing the average delay on Sundays in year 2009 in the source visualization, the graphic that contains a data point representing Sundays of year 2009 is picked and highlighted in the target visualization.
Source
Target
mstrmojo.customviz.PICKED_TYPE.BOTH means if we select headers in the source visualization, both the graphics which represent the headers and the data point with the same values will be picked and highlighted.
The picked graphics are a union of the graphics picked by mstrmojo.customviz.PICKED_TYPE.ATTR and mstrmojo.customviz.PICKED_TYPE.METRIC.
Source
Target
Defines the projection from graphics in the source visualization to the graphics in the target custom visualization.
It can be set to the following constants:
- mstrmojo.customviz.PICKED_CRITERIA.SUBSECTION
- mstrmojo.customviz.PICKED_CRITERIA.INTERSECTION
mstrmojo.customviz.PICKED_CRITERIA.SUBSECTION means only if the set of header(s) in the graphic model bound to a graphic in the source visualization is a subset(not necessarily a true subset) of the set of header(s) in the graphic model bound to the a graphic in the target visualization, the projection is valid.
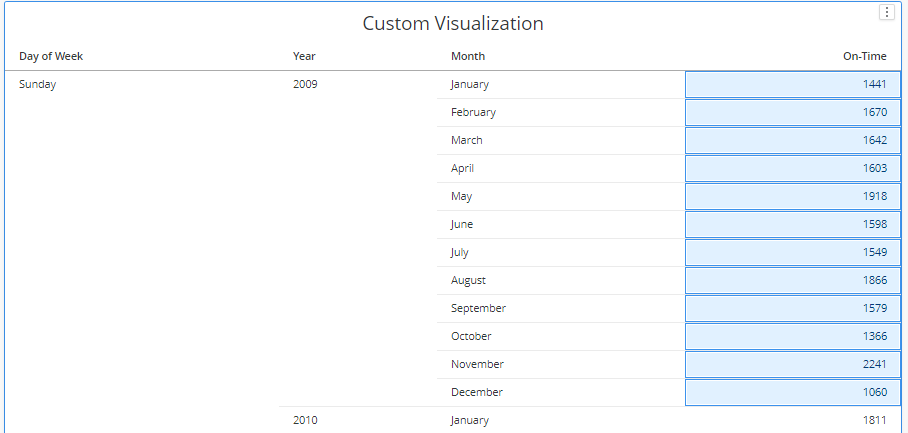
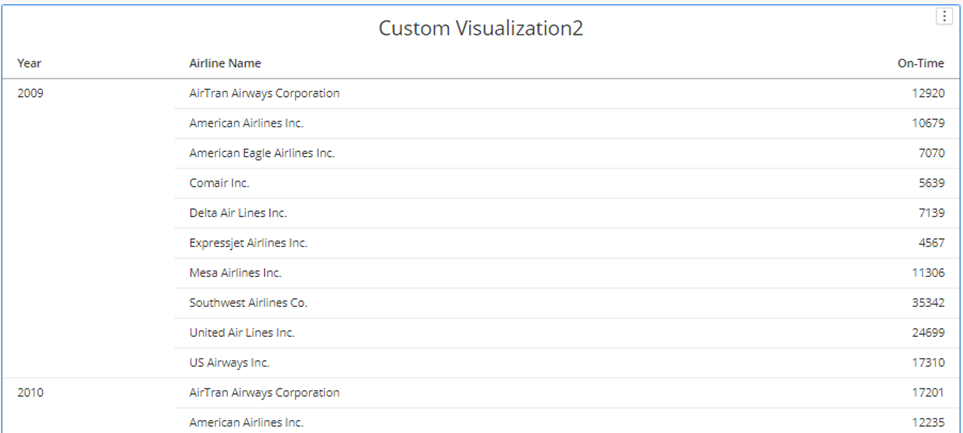
For example, if we set the metric parameter to mstrmojo.customviz.PICKED_TYPE.METRIC and select the data point representing the average delay on Sundays in year 2009 in the source visualization, all the graphics that contain some statistic values on Sundays of all the months in year 2009 are picked and highlighted in the target visualization. However, the graphic that contains statistic values of any airline in 2009 is not picked.
Source
Target
Target 2
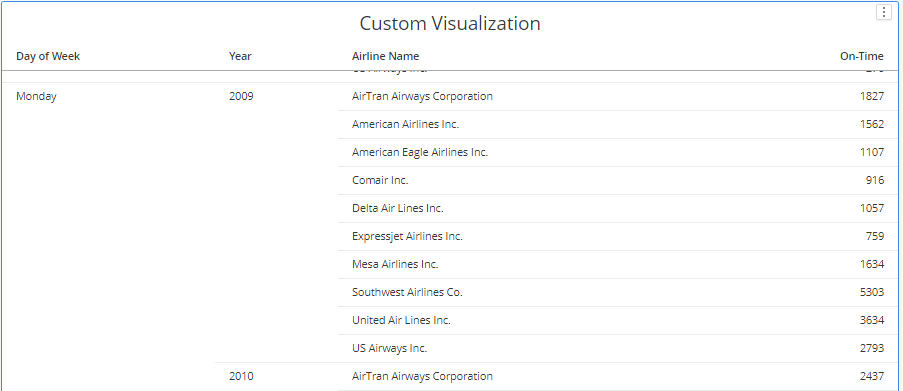
mstrmojo.customviz.PICKED_CRITERIA.INTERSECTION means only if the set of header(s) in the graphic model bound to a graphic in the source visualization has a non-empty intersection with the set of header(s) in the graphic model bound to a graphic in the target visualization, the projection is valid.
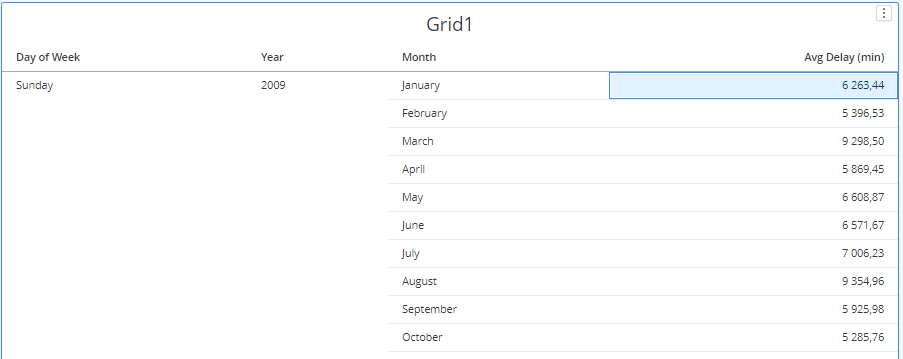
For example, if we set the metric parameter to mstrmojo.customviz.PICKED_TYPE.METRIC, and select the data point representing the average delay on Sundays in January of year 2009 in the source visualization, all graphics that contain statistic values of all airlines on Sundays of year 2009 are picked and highlighted in the target visualization. However, the graphic that contains statistic values for Mondays in year 2010 is not picked.
Source
Target
Target
If the metric parameter is set to mstrmojo.customviz.PICKED_TYPE.ATTR and the data points in the source visualization have more than one header, the criteria parameter is set to mstrmojo.customviz.PICKED_CRITERIA.INTERSECTION.