MicroStrategy ONE
Example of a conditional metric with a level
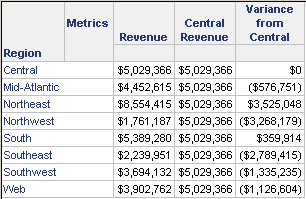
You can create a metric with both a condition and a level. For instance, you need a report that compares all regional sales to sales in the Central region. Both conditions and levels are applied to metrics to achieve the desired result, which is shown below.

The following descriptions of the metrics used in this report include metric definitions. In each metric definition, the information between the curly braces—{ }—indicates the metric level. Additional level properties have been displayed in these definitions to indicate the grouping and filtering settings. For descriptions of the symbols, see Metric Editor Formula tab: Metric level property symbols. For more general information on level metrics, see About level metrics.
-
Revenue
-
Sum(Revenue) {~+}
-
In the metric definition above, Revenue is the Revenue fact. The {~+} indicates that this metric calculates as the report level. In other words, the metric calculates revenue for the attributes on the report, in this case, the regional revenue.
-
-
Central Revenue
-
Sum(Revenue) {~+,!Region+} <[Central]>
-
where Revenue is the Revenue fact. This metric contains both a level (Region) and a condition (Central). It returns the revenue for the Central region, for each row on the report. How?
-
The condition allows data only from the Central region into the metric calculation, regardless of what the report contains. The metric now returns the correct data (that is, $5,029,366) for every row on the report. You might think that your Central Revenue metric is complete. However, if you place this on the report, only one row, Central, would be returned. Why?
-
Think of the metric results as tables of data. The table for the Revenue metric contains a row for each of the regions in the project, with its corresponding revenue amount. The table for the Central Revenue metric contains only one row, the revenue for the Central region. The tables are matched on the Region column to create the report. The only match is Central, so only that row is returned. How can more rows be included on the report?
-
Adding a level to the metric, with grouping set to none and a target of Region, returns eight rows of data in the report. The target is the attribute level at which the metric calculation groups. The target of the level is Region, but it can be any parent attribute of the attribute on the report (Region, in this case). So using Country would also work, since having the grouping set to none is more important than the actual attribute in the target.
-
No grouping means that the metric does not group on the target, so the single row of the Central region revenue is paired with each row of the Revenue metric table.
-
Standard filtering for the level, which is the default setting, allows the metric condition to apply to the metric calculation. Change the filtering to ignore, for example, and the metric condition is disregarded, defeating the purpose of the condition.
-
-
Variance from Central
-
(Revenue - [Central Revenue])
-
where Revenue and Central Revenue are the metrics created above. This is a compound metric, since it uses an arithmetic operator (-). The levels and conditions set on the component metrics do not change when the metrics are combined in the compound metric, so the metric calculation is a straight-forward—Revenue - Central Revenue.
-
For a definition of compound metrics, including examples, see Creating compound metrics.
-
