MicroStrategy ONE
Analyzing data in a tabular layout: Interactive Grids
Some documents may display data in an interactive grid, as shown in the example below.
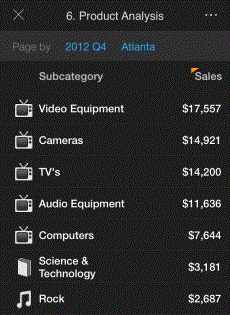
In this interactive grid, attributes and metric values are displayed in the columns and rows, and grouping appears at the top of the screen.
The actions that you can perform depend on how the table was designed. You may be able to do the following:
-
If a column has an orange triangle above its title, the column contains more than one metric. You can tap the column's title to switch between metrics.
-
To sort the grid by a column, tap and hold the title of the column. Click Sort, then choose Ascending or Descending to sort the grid by the column.
-
To undo a sort, tap and hold the title of the column you used to sort the grid. Click Clear Sort.
-
To display different groups of data, tap different page-bys.
-
Tap on objects to drill. For more information about drilling, see Viewing data at different levels: drilling.
-
Tap on objects to follow links. For more information about linking, see Viewing reports and documents: links, and Opening iPhone applications in documents using links.
-
To toggle between full screen and non-full screen mode, tap the center of the screen once.
-
To switch the page displayed, swipe across the screen.