Strategy One
Level Metrics: How to Modify the Context of Data Calculations
Before You Begin
You must understand aggregating or calculating data at various levels of the business concepts related to a report's results. For a refresher on data aggregation levels in MicroStrategy, see the Advanced Reporting Help.
About Level Metrics
Level metrics are metrics that are evaluated at a set level of data, regardless of what is contained on the report they are placed on. By default, metrics are evaluated at the level of the attributes on the report on which they are placed (called the report level). For example, a revenue metric is evaluated at the report level by default. When the metric is placed on a report containing Region, the metric calculates regional revenue. When it is placed on a report containing Customer, the metric calculates the revenue for each customer. In contrast, if you create a level metric with revenue evaluated at the Year level, the metric calculates yearly revenue when placed on either report.
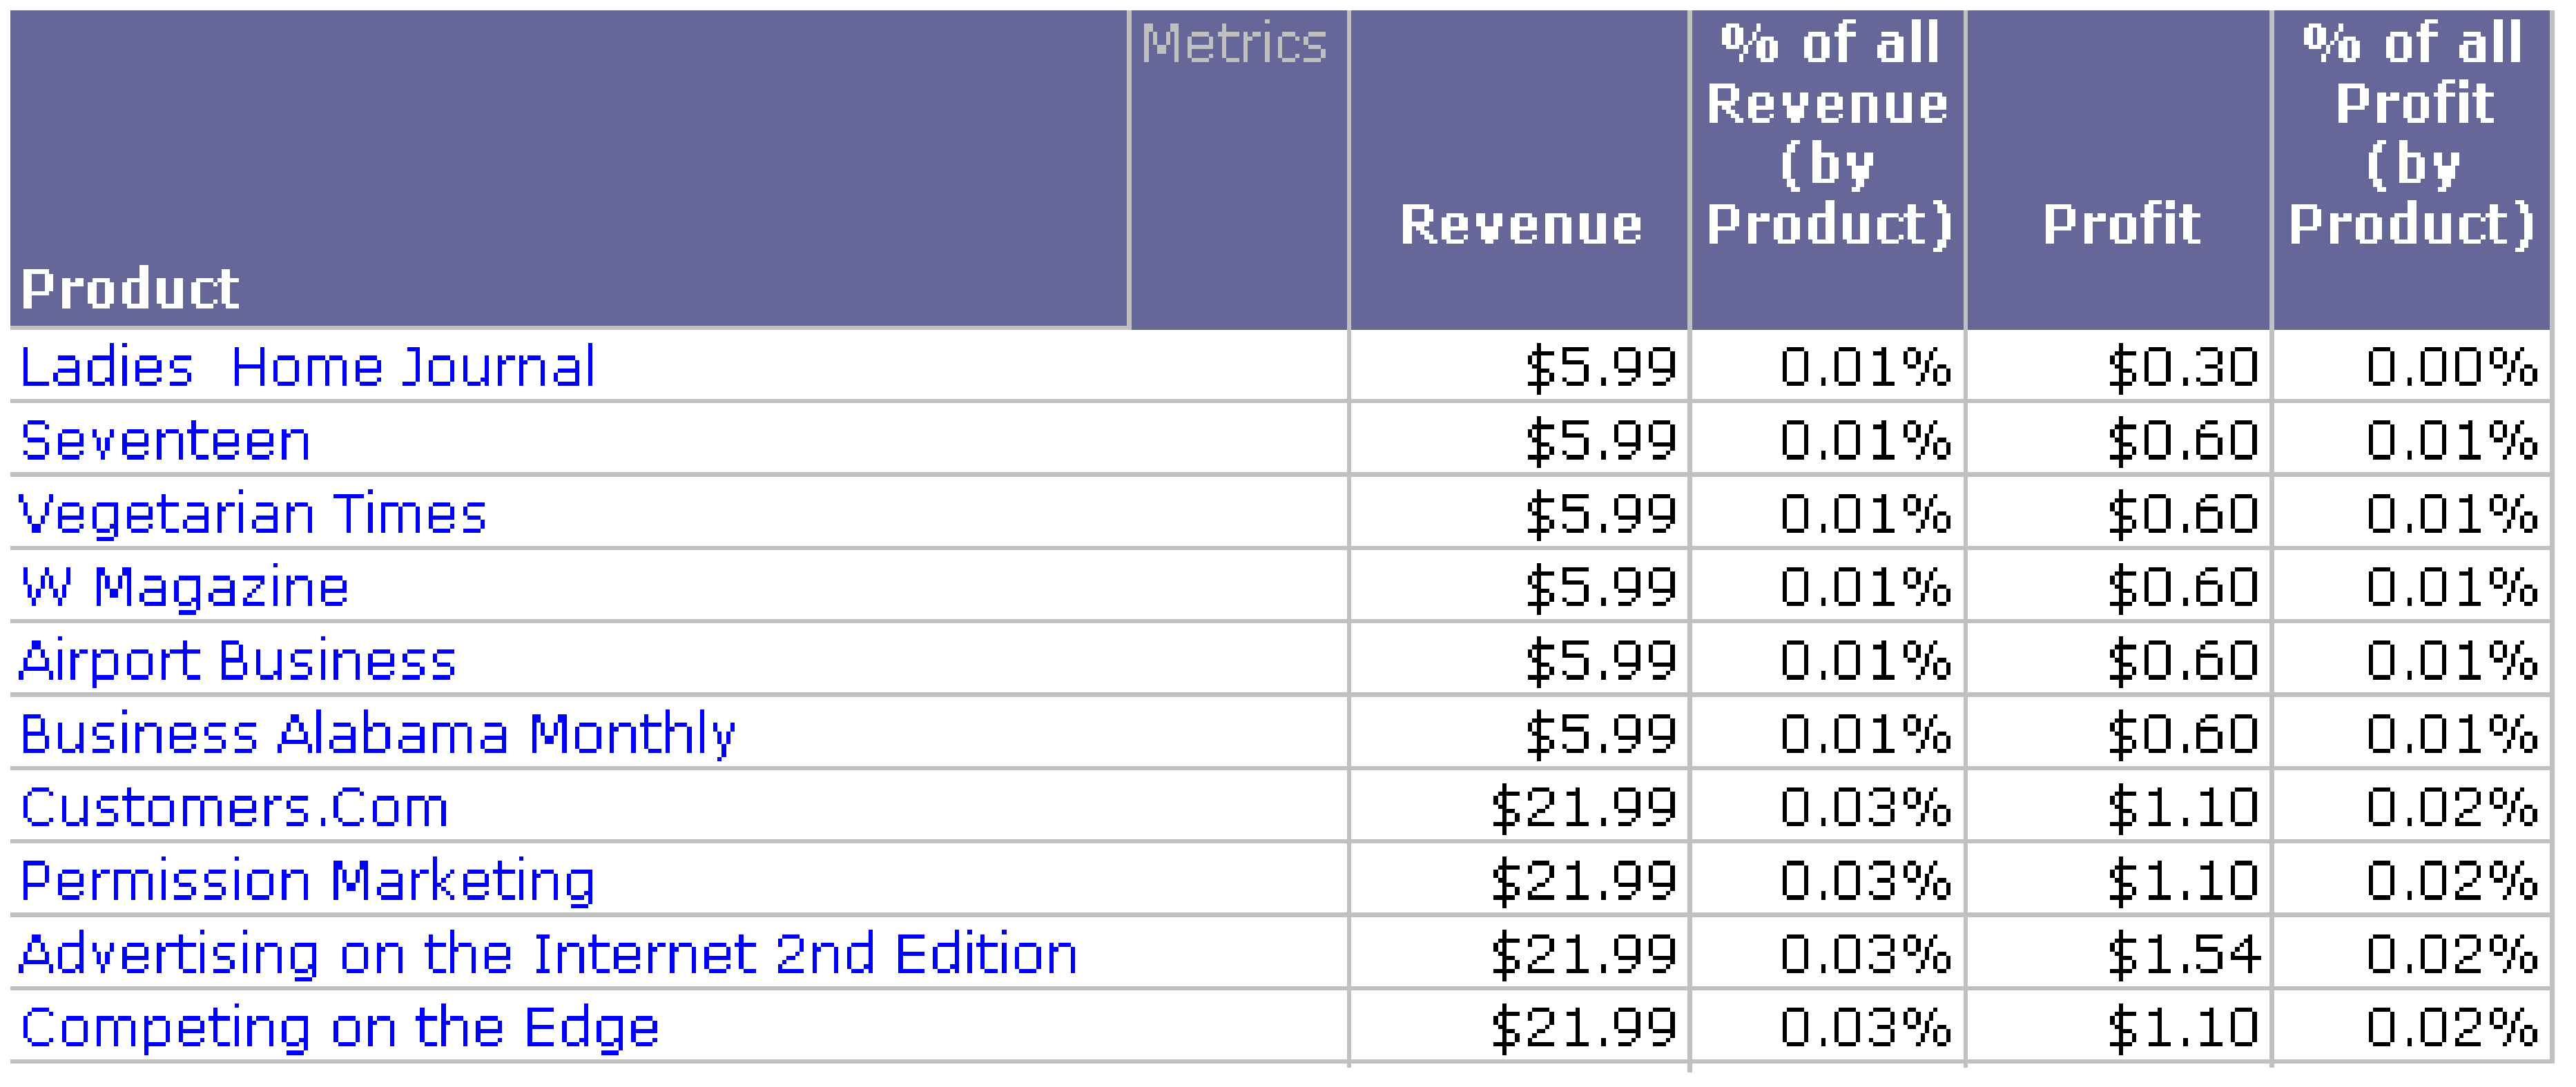
Level metrics are useful for determining the contribution of one object to the whole. For example, you need to determine the contribution to revenue and profit of each individual product that you sell.

In the example above, the Revenue metric is calculated at the Product level, and each revenue value displayed in the report contains the revenue generated by the sale of a specific product, such as Ladies Home Journal or Seventeen magazine. To calculate the contribution of each product to the total revenue, however, you need to divide the revenue at the product level by the revenue taken across all products at once. You do this using level metrics, which allow you to specify the level at which metrics are calculated.
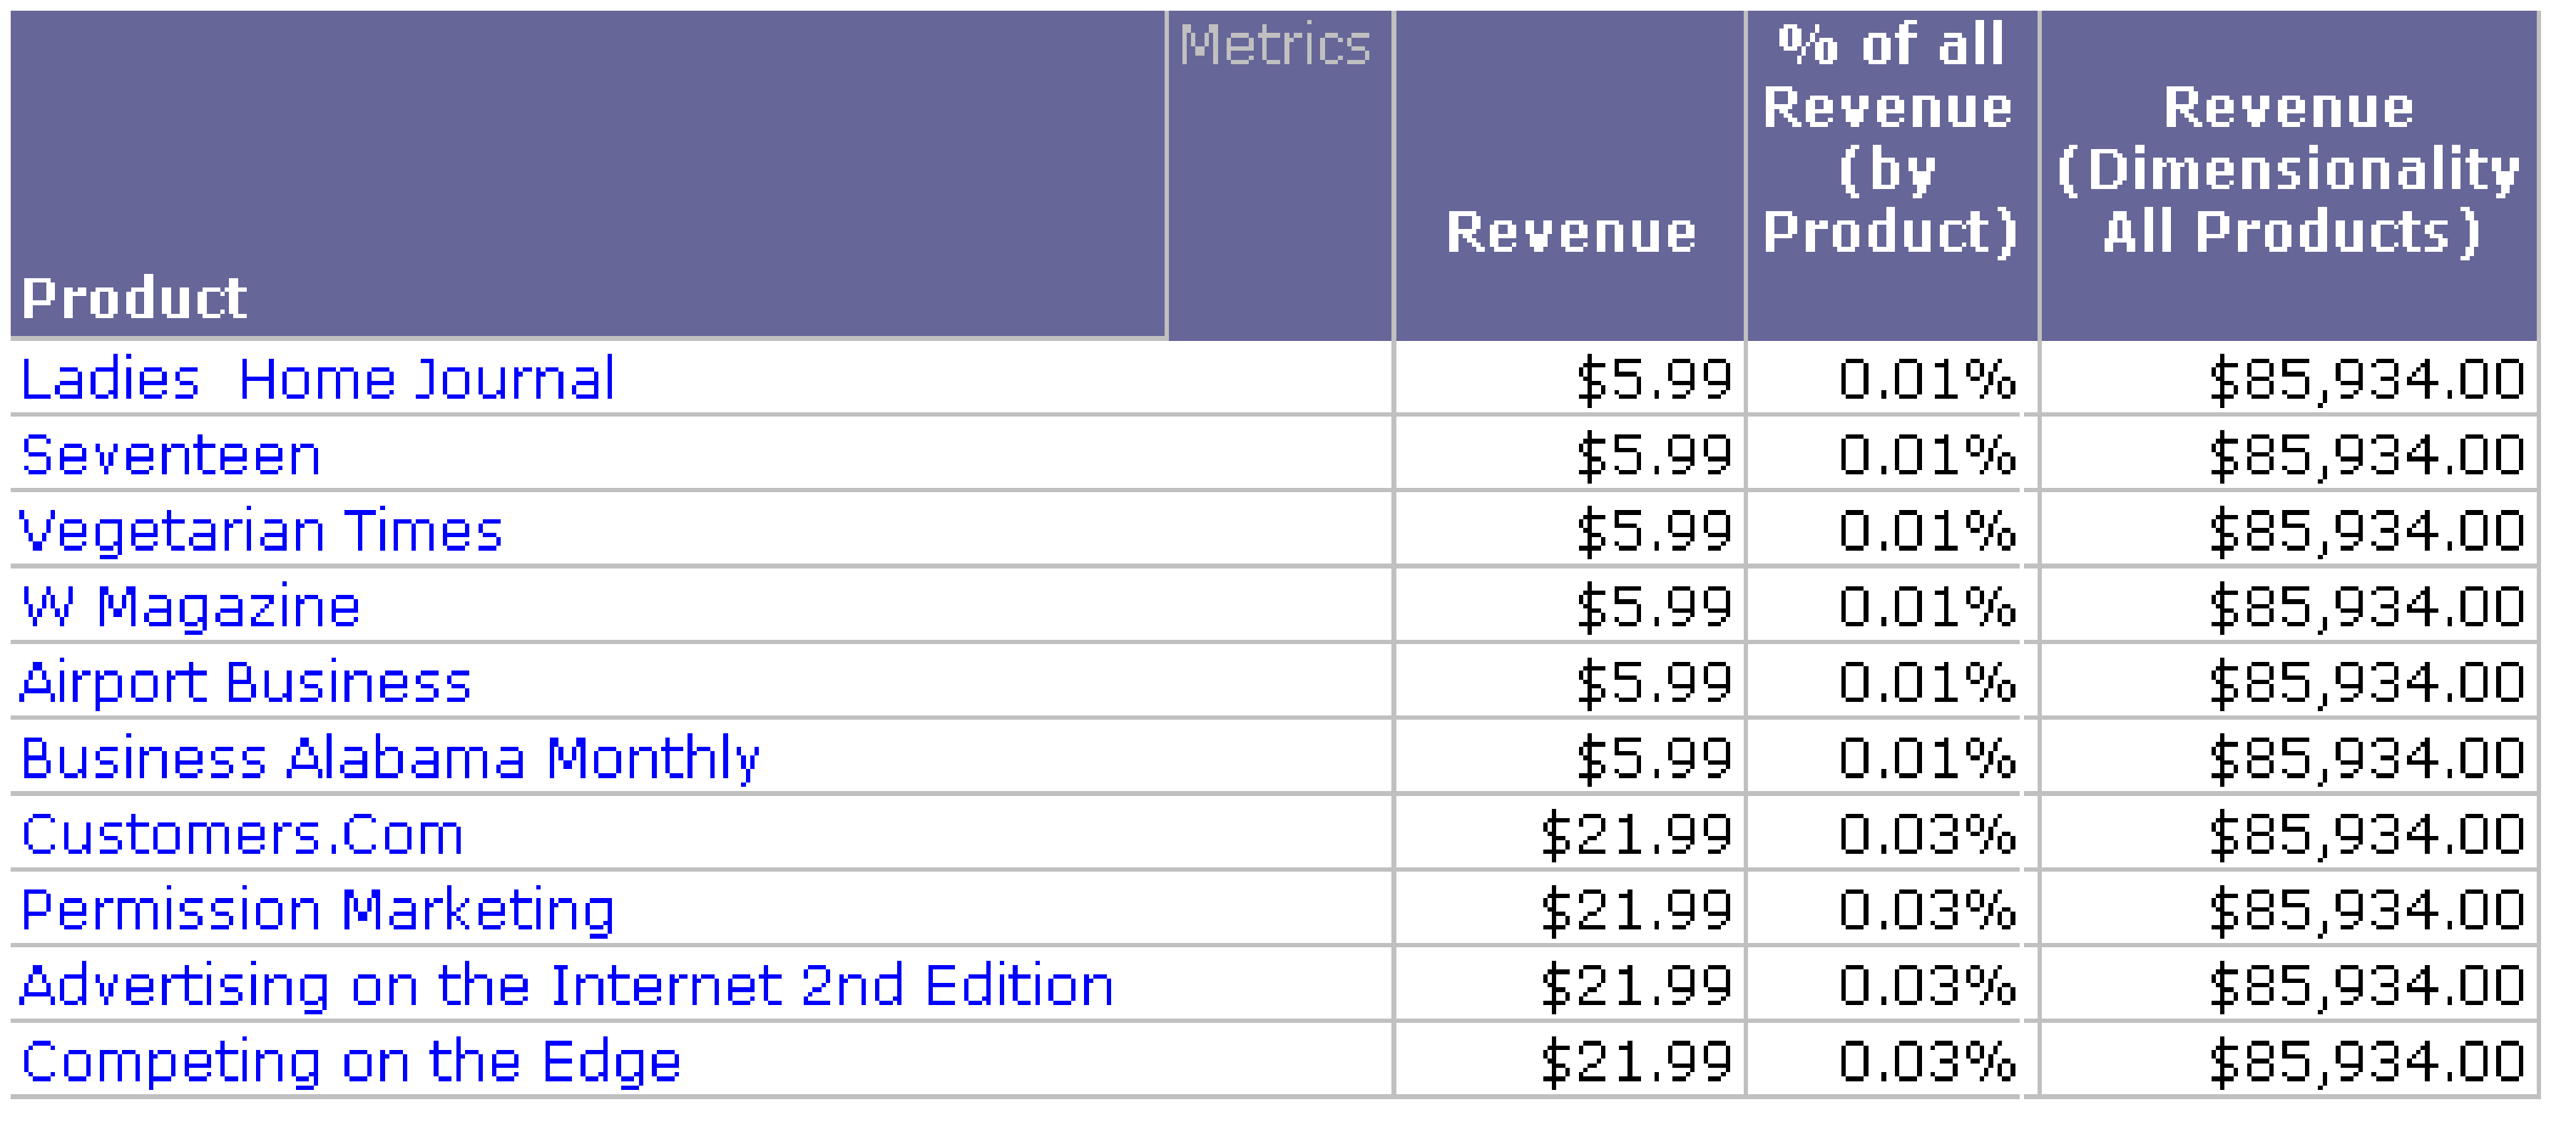
In the example below, the Revenue metric is calculated at the report level, for each product. In contrast, the Revenue (Dimensionality All Products) metric displays the revenue of all the products combined. The contribution metric, % of All Revenue (by Product), is created by dividing the Revenue metric by the Revenue (Dimensionality All Products) metric.

The level of a metric, also called its dimensionality, is made up of the following components:
- Target:
The attribute level at which the metric calculates. The target can
be an attribute or a hierarchy. Using a hierarchy allows the level
metric to dynamically adapt to the report. When placed on a report
with attributes from that hierarchy, the metric calculates at the
level of the lowest attribute of that hierarchy. For specifics on
using a hierarchy as a target, see the Advanced Reporting
Help.
If you specify an attribute as the calculation level of a metric, the metric-specified attribute level overrides the default report level. For information about how the report level provides flexibility and the effects of removing it, see the Advanced Reporting Help. - Grouping: Determines how the metric aggregates. For example, you can choose to group and calculate metric data based on the attribute selected as the target.
- Filtering: Determines how the report filter affects the calculation of the metric. For example, if a report displays Revenue metric data across different product categories and the report filter only includes Literature and Travel, you can choose to include only data from Literature and Travel when the metric is calculated.
For more detailed descriptions and examples of level metrics and their components, including how the target, grouping, and filtering options work together, see the Advanced Reporting Help.
To create a metric, you must define the metric's formula, which consists of the following:
- Function: The calculation applied to your business data, such as Sum or Count. Depending on how you create the metric, your metric may contain multiple functions.
- Expression: The business data from your data source. The expression can contain business facts, attributes, or other metrics.
Steps to create a level metric are below. If you want to create the metric by defining the metric's formula directly, see Metric Formula Editor.
To create a level metric
- Click Create on any page, and select New Metric. The Select a Function or Template dialog box opens.
- From the drop-down list, select Metric Templates (at the bottom of the list). Select Level.
- Click Next. The Function Editor opens.
- From the Aggregation Function drop-down list, select the function to use to create the metric.
- Define the metric expression by doing one of
the following:
- To type
objects to add to the expression directly, type the name of the
object in the Expression
field. As you type, matching objects are displayed in a drop-down
list. You can click an object or continue to type. You can type
multiple objects, such as
Revenue-Profit. - To specify
the expression by choosing an object, click the Browse
icon
 . The Select an
Object dialog box opens. Either navigate to and select an object,
or search for an object.
- To type
objects to add to the expression directly, type the name of the
object in the Expression
field. As you type, matching objects are displayed in a drop-down
list. You can click an object or continue to type. You can type
multiple objects, such as
- If the options in the Level area are not displayed, expand the Level option.
- By
default, metrics are evaluated at the level of the attributes on the
report; this is called the report level. The report level allows the
metric calculation to adapt to different reports. You can remove the
report level from the metric. If you do this, only the level explicitly
set on the metric affects the metric calculation, regardless of the
attributes placed on the report. You do not have to remove the report
level to add levels to the metric. For a more detailed description
of the report level, and the impact of removing it, see the Advanced Reporting
Help.
Do one of the following:
- To remove
the report level from the metric, click the Delete
icon
 next to Report
Level.
 - To add
the report level to the metric after it has been deleted, click
the Add Report Level icon
 .
.
- To remove
the report level from the metric, click the Delete
icon
- To define the attribute level
at which the metric is calculated (called the target), click the Browse icon
 .
Browse to and select the target.
 - Click the
Level Options icon
 next to the target that you added.
- You can define how the report
filter affects the metric calculation. From the Relationship
with Report Filter drop-down list, select one of the following:
- To include only data that meets the conditions in the report filter in the metric calculation, select Standard filtering.
- To raise the level of the report filter to the level of the target, if possible, then apply the report filter to the metric calculation, select Absolute filtering. For example, the report filter contains the Washington, DC, Boston, and New York call centers, but the Revenue metric is calculated at the Region level. Because Call Center is a child attribute of Region, the report filter's level is raised to the Region level, and the report filter is treated as if it includes the regions that contain Washington, DC, Boston, and New York (in this case, Mid-Atlantic and Northeast). Data from all call centers in the Mid-Atlantic or Northeast regions are included in the metric calculation, including call centers that are not Washington, DC, Boston, or New York.
- To ignore any conditions in the report filter that are based on the target attribute, as well as any parent or child attributes of the target, select Ignore filtering. For example, if you have a regional revenue metric on a report, any conditions based on Country, Region, or Call Center in the report filter are ignored when calculating the metric. However, a condition based on Year would not be ignored, since Year is not directly related to Region.
- To allow the target and group components of the level to define the filter, select None.
- You can determine how the metric
is grouped, or aggregated, when displayed on a report. From the Metric Aggregations drop-down list,
select one of the following:
- Select Standard to group data in the metric by the attribute level of the target.
Select None to exclude the target attribute from being used to group data in the metric. Any children of the target attribute are also excluded. This option is available for metrics calculated at a set level, as opposed to the report level.
The following options are only used for nonaggregatable metrics. A nonaggregatable metric, such as an inventory metric, is one that should not be aggregated across an attribute. For example, if you have monthly inventory numbers in your data warehouse and want to calculate the yearly inventory, adding the monthly numbers together does not provide a useful business measure. Instead, you may want to use the end-on-hand and beginning-on-hand inventory numbers to see how the total inventory changed during the year. The following options are available:
- Select Beginning lookup to use the first value in the lookup table.
- Select Ending lookup to use the last value in the lookup table.
- Select Beginning fact to use the first value in the fact table.
- Select Ending fact to use the last value in the fact table.
- Click OK.
- If desired, repeat the appropriate steps above to add additional levels to the metric.
- You can define how the metric header and the metric values are formatted and displayed in a report. For example, you can define how numeric values are displayed, font styles and sizes, and cell display colors. Your formatting will be applied to the metric regardless of the report on which it is placed. For steps to format the metric, see Format Dialog Box for Metrics.
- You can define options related
to metric filter and metric calculation interaction. In the Level
area, click the Level Advanced Options
icon
 , then select the appropriate options in
the Level Advanced
Options dialog box.
 - To save your changes, click Save. The Save As dialog box opens. Navigate to the folder where you want to save the metric. Type a Name and Description for the metric, and click OK.
- You can add conditions or transformations
to the metric. Choose from the following:
- Metric conditions (also called metric filters) are applied to the metric without affecting any other metrics on a report. For steps to add a condition, see Add the Condition. For a more detailed description of conditional metrics, including examples, see Conditional Metrics: How to Filter Data Calculations. For information on report filters, which affect multiple metrics on a report, see Introduction to Filters.
- A transformation is an attribute element-based offset that you can use to compare data. For example, a transformation metric can help a user compare last month's revenue to this month's revenue. For steps to add transformations, see Add a transformation. For a more detailed description of transformation metrics, including examples, see Transformation Metrics: Time-Based and Other Comparisons.
Related Topics
Level Options Dialog Box for information on level filtering and aggregations options
Level Advanced Options Dialog Box for options related to the metric filter and metric calculation interaction
Introduction to Metrics for background information about metrics in general
