Strategy One
領域によるマップ ビジュアリゼーションの概要
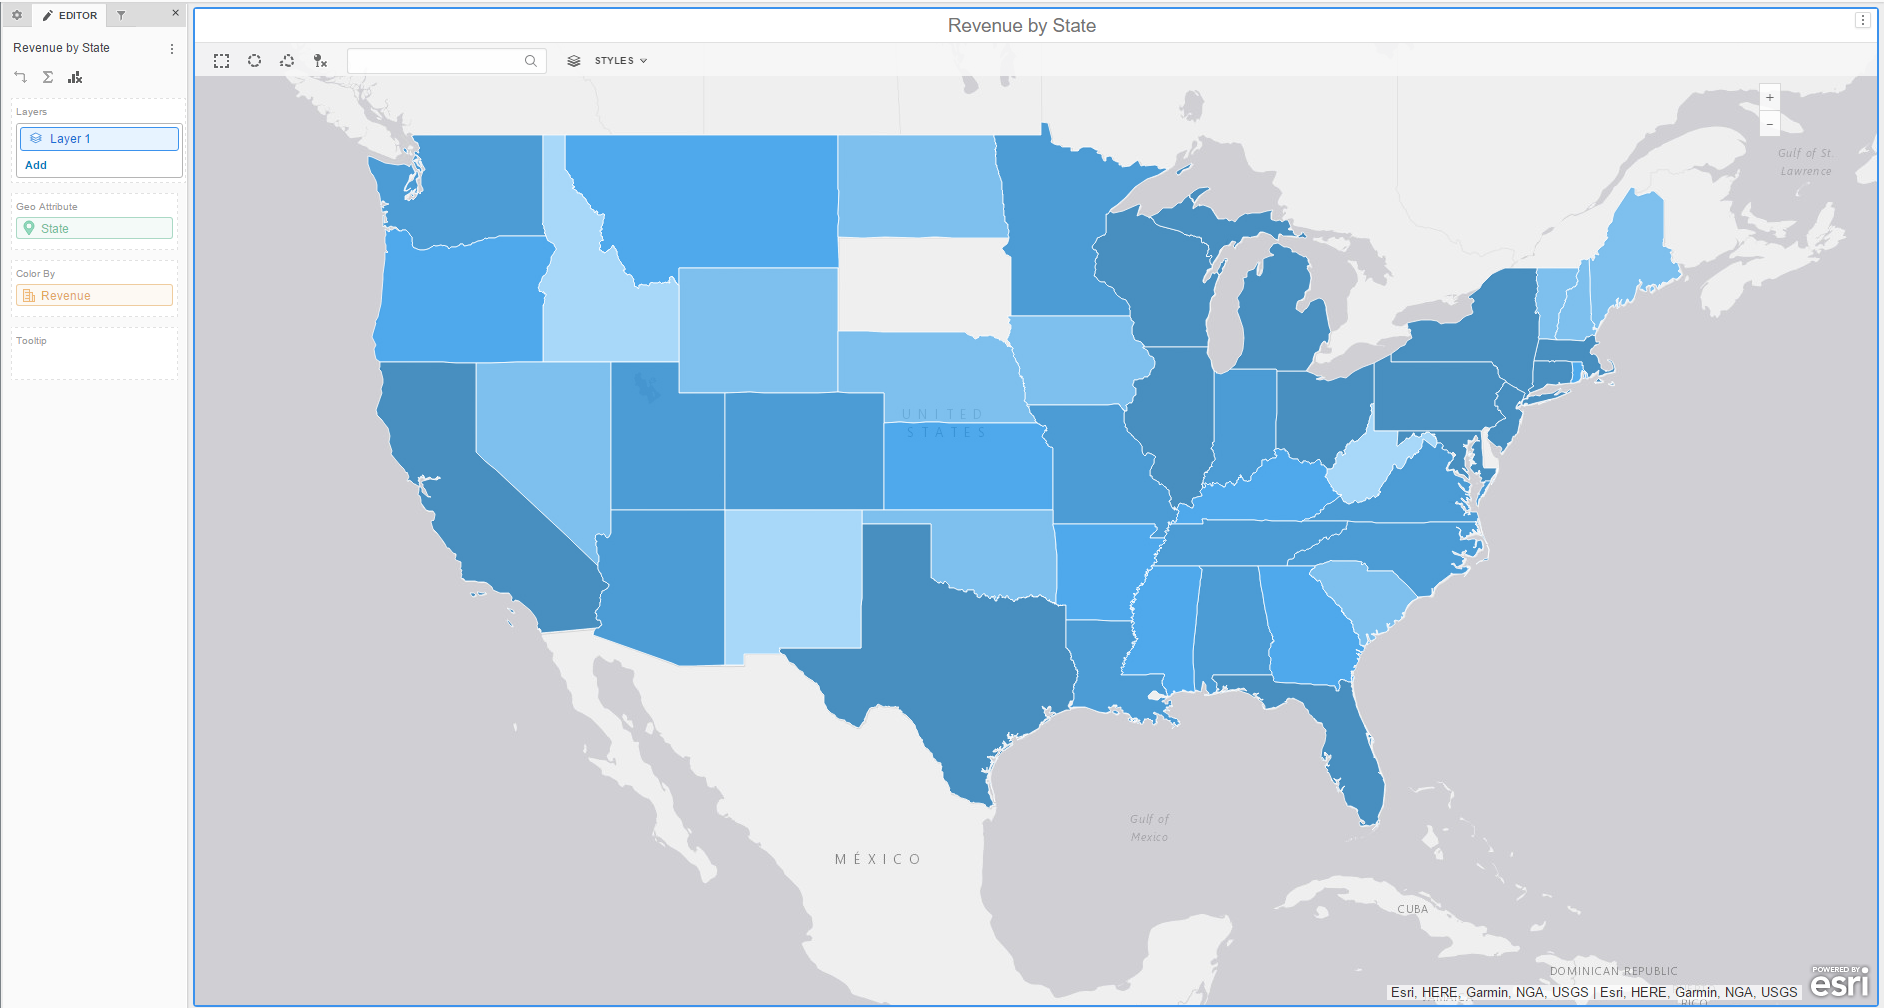
地図に場所を領域として表示できます。地図上の領域は、地理的地域を表す地図上の色付けされた場所 (国、州、および市区郡など) です。メトリックの値に基づいて、領域を色分けすることができます。
領域を示すマップ ビジュアリゼーションを使用して、以下のタスクを行うことができます。
- 地形図および衛星写真などの異なる表示モードを表示する。
- ビジュアリゼーション内の各地域をメトリック値に基づいて異なる色に色分けして表示する。
- 地図の地域に追加のツールヒントを追加して、ビジュアリゼーション内の領域にカーソルを置いたときに、場所についての追加情報を表示する。