Strategy ONE
Banding Functions
Banding functions are used to group data on a report so that it is both more comprehensible and aesthetically pleasing than when it is displayed as one contiguous list. MicroStrategy provides different banding options for you to use, depending on how you want to divide your data. The banding functions, their syntaxes, and examples are listed below.
For information on banding functions in custom groups, see the Advanced Reporting Help.
Banding
This function maps metric values that fall within a certain range to a particular integer band value. The range and band values are determined by the parameter input to the function. For example, if 5,000 is the specified range, the dollar sales are shown in bands of 0 - 5,000, 5,001 - 10,000, 10,001 - 15,000, and so on. Banding is a single-value function.
Syntax
Banding <HasResidue>(Argument, StartAt, StopAt, Size)
Where:
Argumentis a metric.StartAtandStopAtare real numbers specifying the full range of the values to be placed in bands.Sizeis a real number indicating the width of each band.HasResidueis aTRUE/FALSEparameter that defines whether an extra band is created for all values that do not fall within theStartAtandStopAtvalues. DefiningHasResidueasTRUEallows the function to create an additional band which is used to identify all values outside of the defined band range.
Usage Notes
Values in the list that fall outside of the start and end values set in the function syntax are assigned a band of 0 (zero) in the report interface.
Example
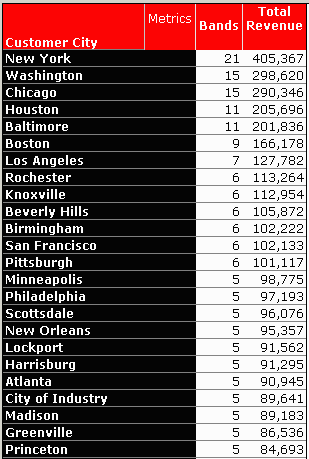
The following example shows how the Banding function acts on report data. In this case the total revenue for each city is used to divide the report data into bands:
- The highest total revenue is 405,367 (New York).
- The lowest revenue is 668 (Cleveland).
The metric function syntax is as follows:
Banding([Total Revenue], 1, 410000, 20000)
- Total Revenue is the metric, defined as
Sum(Revenue), representing the list of values acted on by the Banding function. - 1 is the value at which banding begins.
- 410,000 is the value at which banding ends.
- 20,000 is the size of the range of values included in each band.
Only part of the resulting report is displayed here.
The result is that 21 bands are created, each encompassing a range of 20,000 dollars of total revenue. To determine the number of bands, 410,000 is divided by 20,000 resulting in 20.5 (rounded to nearest integer, 21). Each band is given an integer value of between 1 and 21.

BandingC (Banding Count)
BandingC returns metric data grouped into a specified number of bands and assigns integer values to the resulting bands (for example, a total of 25,000 in dollar sales shown in five equal bands). This is a single-value function.
Syntax
BandingC <HasResidue>(Argument, StartAt, StopAt, BandCount)
Where:
Argumentis a metric.BandCountis a positive integer indicating the number of bands into which the total is divided.StartAtandStopAtare real numbers specifying the full range of the values to be placed in bands.HasResidueis aTRUE/FALSEparameter that defines whether an extra band is created for all values that do not fall within theStartAtandStopAtvalues. DefiningHasResidueasTrueallows the function to create an additional band which is used to identify all values outside of the defined band range.
Usage Notes
Values that fall outside of the range indicated by the Start and Stop values are assigned a band of 0 (zero).
Example
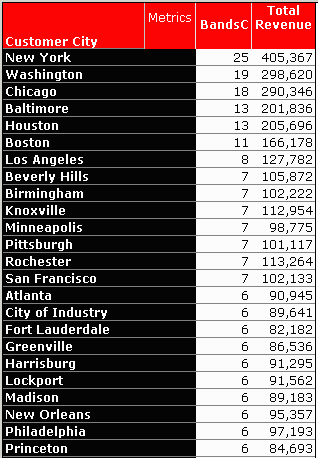
The following example shows how the BandingC function acts on report data. This example uses the same set of values as the example for the Banding function. Using the BandingC function, you can designate the number of bands created for the range of values.
The metric function syntax is as follows:
BandingC([Total Revenue], 1, 410000, 25)
Where:
- Total Revenue is the metric, defined as
Sum(Revenue), representing the list of values acted on by the BandingC function. - 1 is the value at which banding begins.
- 410,000 is the value at which banding ends.
- 25 is the number of bands into which you want the values divided.
Only part of the resulting report is displayed here.
The result is that 20 bands of equal sizes are created. To determine the range of each band, 410,000 is divided by 25 resulting in bands of 16,400. Each band is given an integer value of between 1 and 25.

BandingP (Banding Points)
Returns metric data grouped into bands identified by user-specified boundary point values (for example, 0 - 5,000, 5,000 - 20,000, 20,000 - 30,000). This function assigns integer values to the resulting metric and allows you to create band intervals of varying widths. This is a single-value function.
Syntax
BandingP <HasResidue>(Argument, Boundary1, Boundary2,..., BoundaryN)
Where:
Argumentis a metric.Boundary1throughBoundaryNare real numbers indicating the cut-off value for each band.Boundary1is less thanBoundary2,Boundary2is less thanBoundary3, and so on.HasResidueis aTRUE/FALSEparameter that defines whether an extra band is created for all values that do not fall within theBoundary1andBoundaryNvalues. DefiningHasResidueasTRUEallows the function to create an additional band which is used to identify all values outside of the defined band range.
Example
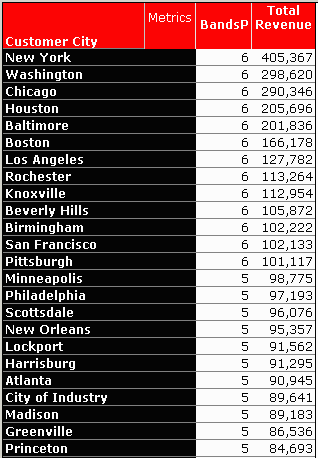
The following example shows how the BandingP function acts on report data. This example again uses the same data set as in the previous examples (Banding and BandingC). Using the BandingP function, you can designate the boundaries for each interval.
The metric function syntax is as follows:
BandingP([Total Revenue], 1,20000,40000,60000,80000,100000,410000)
Where:
- Total Revenue is the metric, defined as
Sum(Revenue), representing the list of values acted on by the BandingP function. - All other values specify the boundaries of an interval. There are six intervals defined as follows:
- Band 1: 1 £ [Total Revenue] < 20000
- Band 2: 20,000 £ [Total Revenue] < 40,000
- Band 3: 40,000 £ [Total Revenue] < 60,000
- Band 4: 60,000 £ [Total Revenue] < 80,000
- Band 5: 80,000 £ [Total Revenue] < 100,000
- Band 6: 100,000 £ [Total Revenue] £ 410,000
Only part of the resulting report is displayed here.

