Strategy ONE
Selecting and viewing a Grid/Graph
Selecting a Grid/Graph
A Grid/Graph has several modes or states of selection.
To select and edit a Grid/Graph
When the Grid/Graph is not selected and your cursor is not over it, it displays without handles or the Select/Move and Add Dataset icons. This normal view is shown below.

When you click the Grid/Graph, the Grid/Graph container is selected. The Select/Move and Add Dataset icons display in its top-left corner, as shown below.

You can resize the Grid/Graph by dragging the resizing handles. You can also move the Grid/Graph by clicking the Select/Move icon and dragging the Grid/Graph.
If a selected Grid/Graph does not resize, it may be locked. A locked Grid/Graph cannot be resized or moved. To unlock it, see Locking and unlocking controls.
When you edit the Grid/Graph, you can add objects to it, format rows and columns, sort, add totals or subtotals, select a different autostyle for the grid, format the graph, assign thresholds, and change various column settings. For details, see Editing data in a Grid/Graph.
Editing changes the grid report or graph report as displayed in the Grid/Graph in the document; it does not change the original report. For this reason, if the Grid/Graph is linked to the original report as a shortcut, you cannot edit the Grid/Graph. You can format the Grid/Graph control within the document, whether it is a shortcut or not. For steps, see Formatting Grid/Graph containers, which discusses borders, title bars, and quick switch, among other options. For steps to unlink a Grid/Graph shortcut so that it is converted to standard Grid/Graph, and more information on shortcuts in general, see Adding a Grid/Graph as a shortcut.
Viewing a Grid/Graph displayed as a grid
When you add a Grid/Graph to a document, it is displayed as a grid (a standard MicroStrategy grid report with rows and columns of attributes and metrics) by default. If the display mode is changed, you can set it to display as a grid again.
To view a Grid/Graph as a grid
-
In MicroStrategy Web, open the document in Design or Editable Mode.
-
Right-click the Grid/Graph, point to View Mode, and select Grid View.
-
Click anywhere outside of the Grid/Graph so that the Grid/Graph is no longer selected.
Viewing a Grid/Graph displayed as a graph
When you insert a Grid/Graph into a document, it is displayed as a grid (a standard MicroStrategy grid report with rows and columns of attributes and metrics) by default. You can choose to display it as a graph, which shows the data visually as in a standard MicroStrategy graph report.
To view a Grid/Graph as a graph
-
In MicroStrategy Web, open the document in Design or Editable Mode.
-
Right-click the Grid/Graph, point to View Mode, and select Graph View.
-
Click anywhere outside of the Grid/Graph so that the grid is no longer selected.
Viewing a Grid/Graph as a grid and a graph at the same time
When you insert a Grid/Graph into a document, it is displayed as a grid (a standard MicroStrategy grid report with rows and columns of attributes and metrics) by default. You can choose to display the Grid/Graph as both a grid and a graph (which displays the data visually as in a standard MicroStrategy graph report) at the same time.
You can also specify how the grid and graph reports are laid out in the document, including what percentage of space each report takes up. For steps, see Specifying the layout for a Grid/Graph displayed as both a grid and a graph.
To view a Grid/Graph as a grid and a graph simultaneously
-
In MicroStrategy Web, open the document in Design or Editable Mode.
-
Right-click the Grid/Graph, point to View Mode, and select Grid and Graph View.
-
Click anywhere outside of the Grid/Graph so that it is no longer selected.
Specifying the layout for a Grid/Graph displayed as both a grid and a graph
You can specify the layout for a Grid/Graph displayed as both a grid and graph. That means that you can determine how the grid and the graph share the space available in the Grid/Graph. The grid and graph can be placed either side by side, or above and below each other by specifying the grid's location relative to the graph. You can also control the relative sizes of the grid and the graph, by specifying the ratio of the size of the grid to the size of the graph.
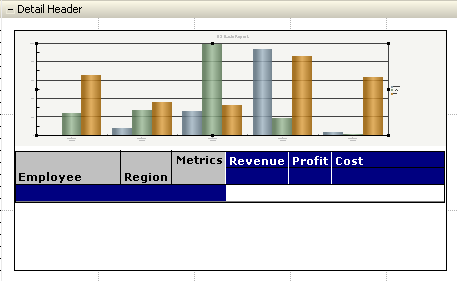
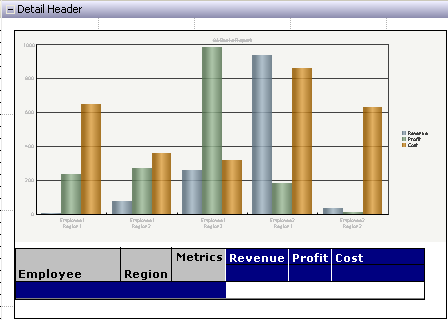
For example, the following Grid/Graph is displayed as both a grid and a graph. It is shown in Design View, so that you can focus on the grid and graph objects, rather than the data. The default settings were not altered, so the grid is placed below the graph, and each occupies half the space of the Grid/Graph.

Since the Grid position is set to Bottom, the Grid area percent setting, which is set to 50 by default, specifies the height ratio. Change the Grid area percent to 25. Now the graph occupies 75% of the height of the Grid/Graph container while the grid only uses 25%, as shown below.

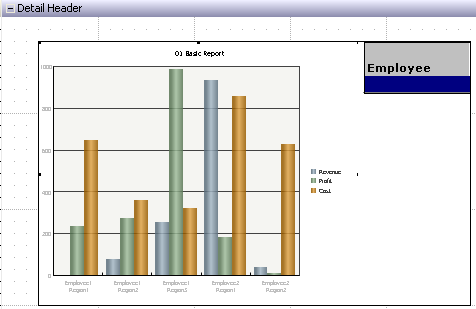
If you change the Grid position to Left or Right, the Grid area percent setting represents the width percentage. If you specify the Grid position as Right, without adjusting the Grid area percent, the Grid/Graph displays as shown below.

The grid uses 25% of the width of the window and is placed to the right of the graph.
The following procedure re-creates the last sample shown above, with the grid to the right, at 25%.
To specify the layout for a Grid/Graph displayed as both a grid and a graph
-
In MicroStrategy Web, open the document in Design or Editable Mode.
-
Right-click the Grid/Graph and select Properties and Formatting. The Properties and Formatting dialog box opens.
-
On the left, select Layout.
-
From the View drop-down list, select Graph and Grid View.
-
From the Grid position drop-down list, select Right, to display the grid to the right of the graph.
-
By default, the grid and graph share the control's window equally. Change Grid Area to 25, so that the grid uses 25% of the width of the Grid/Graph window.
-
Click OK to save your changes and return to the document.
