MicroStrategy ONE
Hierarchies
A hierarchy is made up of a group of related business attributes that are conceptually related to each other. (For a description and examples of attributes, see Business attributes.)
For example, an organization's data source tables may be updated daily with sales data, and they may store inventory information that is updated monthly. The data source may also store specific financial data in its tables on a quarterly or annual basis. All of this data is stored based on the concepts of day, month, quarter, and year. Therefore, when a MicroStrategy project is created based on the data in this data source, attributes will likely be created to represent Day, Month, Quarter, and Year so that daily sales data can be reported, monthly inventory can be reported, and reports of financial data can display quarterly or annual details and summaries for corporate presentations.
If your data source contains data on daily sales figures, can you see weekly, monthly, or annual sales figures? Yes, you can if you drill to that data, which works because of hierarchies.
The attributes Day, Month, Quarter, and Year all share one thing in common: they are all concepts that describe the larger idea of time. Because they are all part of the same higher-level concept, these attributes are combined into a group called a hierarchy; in this case, the attributes Day, Month, Quarter, and Year are combined into the Time hierarchy. Within a hierarchy, attributes are arranged in a specific way that is based on their relationship to each other. The Year attribute is the highest-level attribute in the Time hierarchy because it encompasses all the other concepts of time (Day, Month, and Quarter). The lowest-level attribute, or least-inclusive attribute, in this hierarchy is Day. This Time hierarchy is shown below:
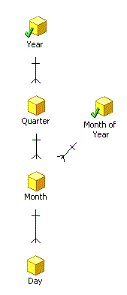
The example above shows a hierarchy of all the attributes that relate to the business concept of Time. (These attributes and this hierarchy are part of the sample Tutorial project.)
This hierarchical grouping of related business attributes is useful for analyzing data in a reporting project. For example, the sales data is stored in the data source on a daily basis. But what if you want to see a report showing monthly sales data? Because Day and Month are part of the same hierarchy, you can simply drill from the daily sales data displayed on the report, up to monthly sales data. The new report you drill to (which contains monthly sales data) is recalculated automatically based on the drilling path you select. "Drilling up" reflects the direction you are drilling into the data in relation to where the attribute exists within the hierarchy: you drill from Day (shown on the report) up the Time hierarchy to Month (which appears on the new, drilled-to report).
In another example, imagine that your company is an Internet-based retailer and has its call centers all over the U.S., and therefore stores its employee data in your data source within the concept of geographical locations within the U.S. The related business attributes within this idea of geographical location become part of the Geography hierarchy. An example using sample data from the Tutorial project is shown below:
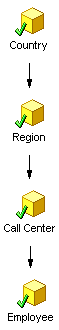
In the Geography hierarchy above, Country is the highest-level attribute and Employee is the lowest-level attribute.
Employee might just as likely be the highest-level attribute in a hierarchy called Employee Resources, which includes related lower level attributes like Profile (Age Range, Gender, Nationality, Ethnicity, Education and Degree Type, Marital Status), Hire Date, Leave Date, Date of Birth, Title, Address, Department, Division, Location, Salary Range Level, and so on. Which attributes are grouped into what hierarchies is decided by your organization's system architect or project designer when a MicroStrategy project is first created. If you are interested in complete details, see the Project Design Help .