Strategy One
Tips and Best Practices
Optimize Key Driver Analysis Visualization Interpretation
Get the most out of your key driver line chart visualization.
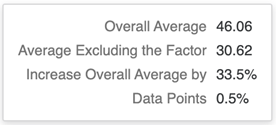
Hover for Insights Hover your cursor over a data point in the Key Driver Analysis visualization to reveal a tooltip. It contains detailed information about key driver analysis values.
FAQs
What key driver analysis method is used?
Strategy produces the key factors by calculating the impact value on the average value. The formula of impact value is:
Impact = (Overall Average Value - Average Value Excluding the Element) / ABS(Overall Average Value)
The impact value can reflect how the key driver influences the overall average. For example, you have a Data Scientist Salary dataset and the Employee Location is US has a 50% impact. This means the job location of a data scientist in the United States increases the overall average salary worldwide by 54%.
Can hyper-parameters be adjusted for key driver analysis?
Currently, Strategy does not expose the hyper-parameter.