Strategy One
Auto Narratives for Dashboard Pages: One-Click Page Summaries
Starting in Strategy One (September 2025), you can display an AI-generated summary of an entire dashboard page using auto narratives.
Auto narratives simplify data interpretation by transforming an entire dashboard page of complex visualizations and data into an easy-to-understand natural language summary. Just as with an auto narrative for a single visualization, this enhances data accessibility, reduces the time needed to identify key insights, and makes data comprehensible to users of all technical backgrounds.
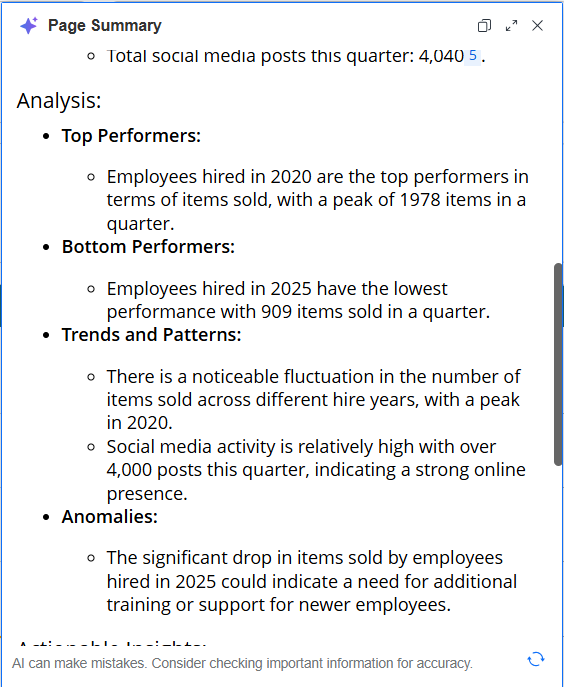
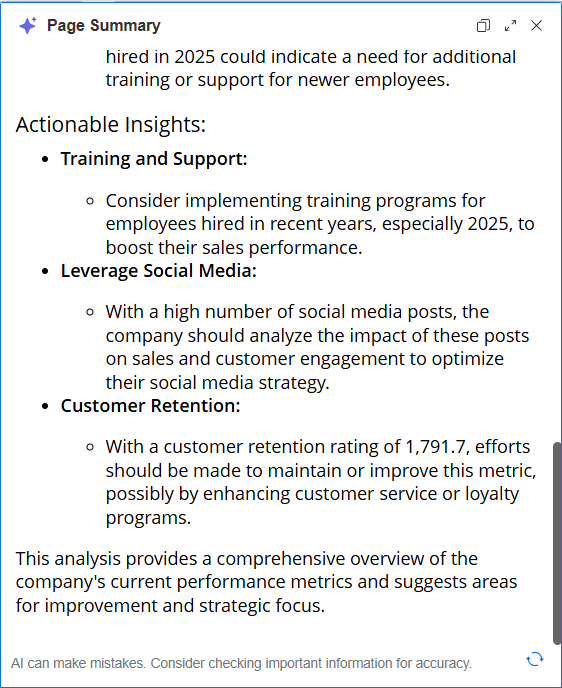
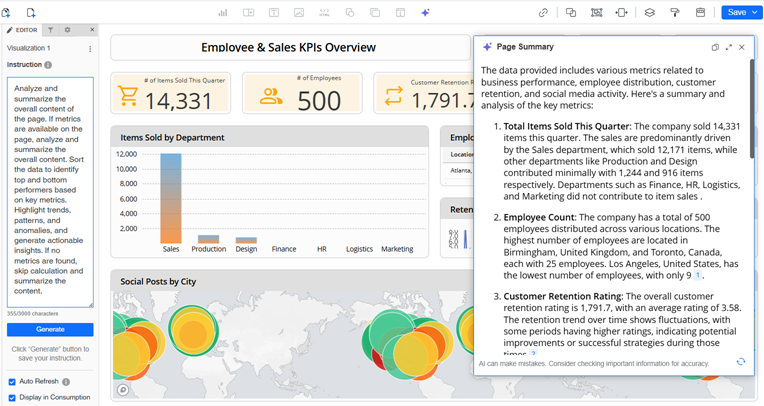
The default page summary instructions provide information on key metrics, an analysis, and actionable insights, as shown in the images below:
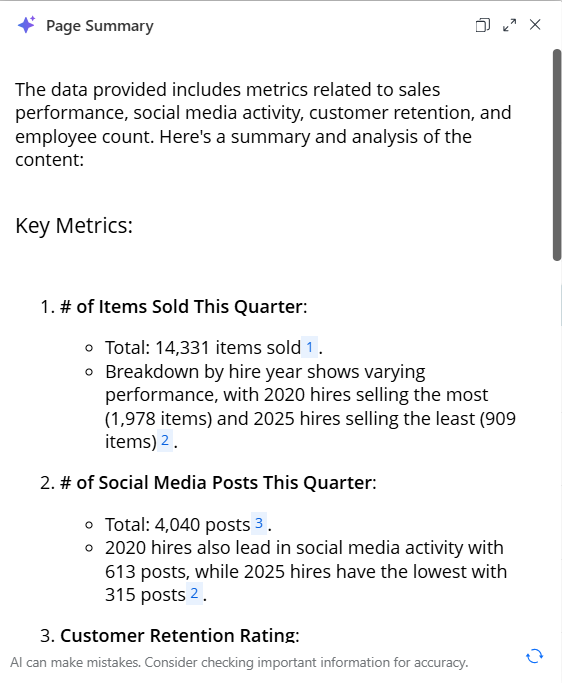
For example, a healthcare analyst at a hospital needs to quickly understand key insights from a specific page within a dashboard, as well as drill down into a particular visualization related to patient outcomes. The analyst opens the Healthcare dashboard, which contains multiple pages with detailed visualizations on patient data, treatment outcomes, and operational metrics. The analyst navigates to the Patient Outcomes Overview page. They want a summary of all the key metrics and trends on this page. The analyst clicks Auto Summary![]() . Auto generates a concise narrative summarizing the most critical insights, such as trends in patient recovery rates, areas of concern, and overall treatment effectiveness.
. Auto generates a concise narrative summarizing the most critical insights, such as trends in patient recovery rates, areas of concern, and overall treatment effectiveness.
Prerequisites
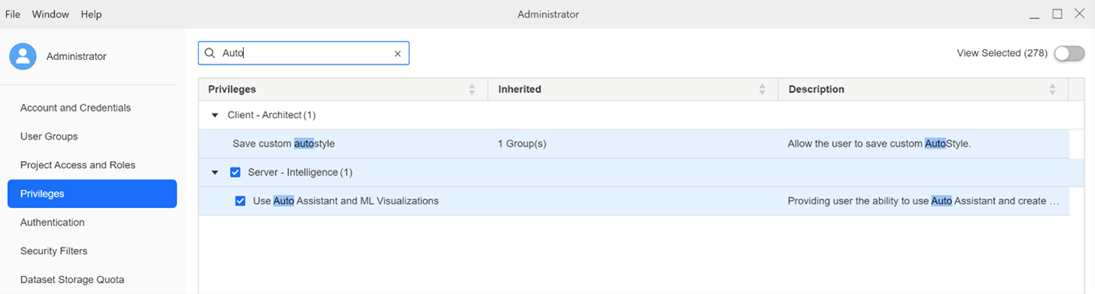
Auto narratives is part of the Strategy AI add-on bundle and is available for Managed Cloud Enterprise (MCE) customers starting in MicroStrategy ONE (September 2024). Only users and user groups with the Use Auto Assistant and ML Visualizations privileges can access auto narratives.
The Auto Summary component must be enabled for the application. See Customize Application Components.
Create an Auto Narrative for a Page
Dashboard authors can create auto narratives.
-
Edit a dashboard.
-
On the page to summarize, click Auto Summary
 in the toolbar.
Auto narratives automatically generates a general summary of the page.
-
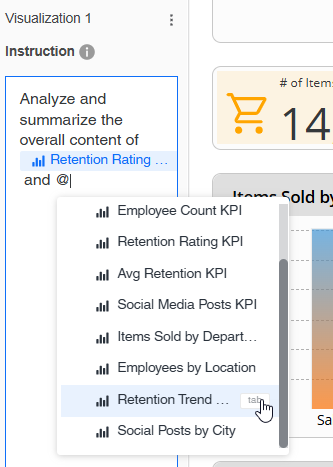
The instructions to create the default page summary display in the Editor panel. You can modify the instructions to customize the summary to suit your business needs. If the dashboard structure changes, or if the Page Summary output is not satisfactory, edit the instruction. For example, to select a specific visualization, in the Instruction box, type @ and select the visualization from the list.
If you make changes to the instructions, click Generate in the Editor panel to view them.
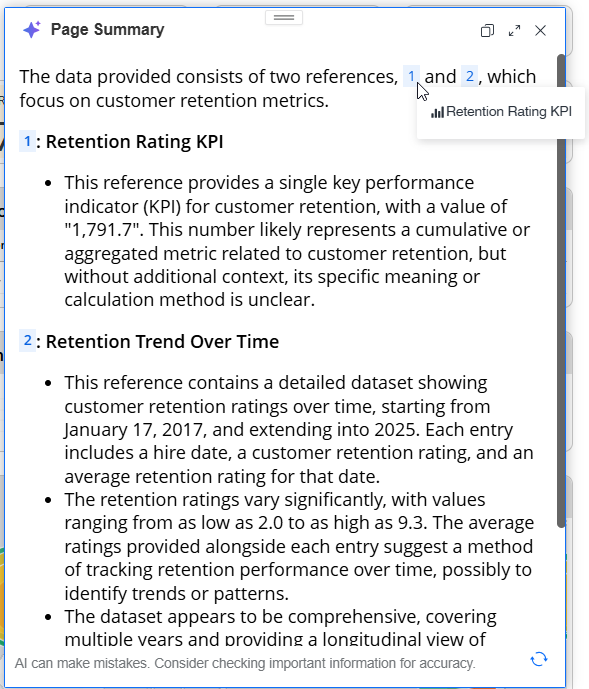
In the example below, the instructions have been modified to analyze and summarize only two visualizations, Retention Rating KPI and Retention Trend Over Time.
After the auto summary is generated with the changes, it includes information only about the selected visualizations, as shown in the results below.
-
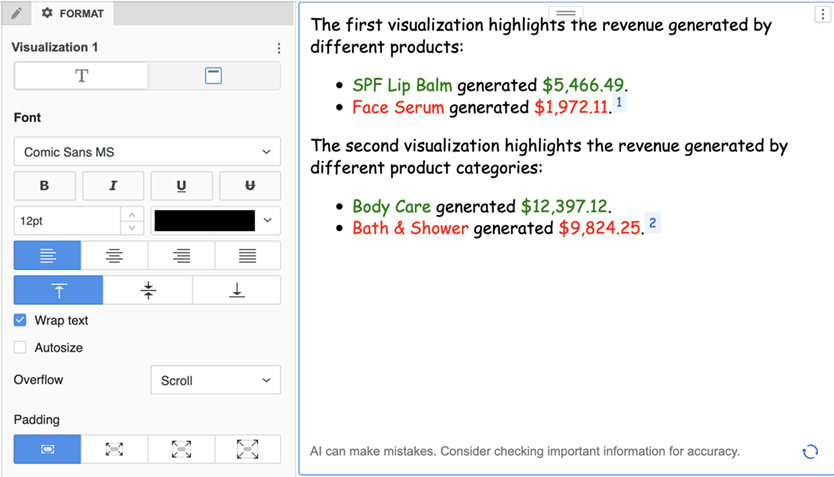
You can include formatting in the Instruction box. For example, you can specify that the summary uses bullet points and full sentences. You can instruct that month names display in blue.
-
If you need to edit the summary and it is not displayed, click Auto Summary
in the toolbar. -
By default, when the page is updated (for example, a filter selection is made or an object is removed from a visualization), the summary is automatically refreshed with the updated data. If you clear the Auto Refresh check box in the Editor panel, the summary does not update, but you can click Refresh in the summary to update it. For an example of this in action, see Consume Page Auto Narratives.
-
By default, the Auto Summary icon
displays when users view this dashboard, allowing them to generate and display their own page summary. To hide the icon, which means that users cannot view the summary, clear the Display in Consumption check box in the Editor panel. -
You can also use the Format panel to modify the text.
Save the Dashboard
- Click Save
 in the toolbar.
 - Navigate to the appropriate location.
- Type the dashboard name in the Save As box.
- You can certify the dashboard, which means that it has been reviewed and is considered an official source of content, based on reliable data.
- Click Save.
Consume Page Auto Narratives
Business users can view auto narratives directly within dashboards, where they are presented as concise, natural language summaries of the page's key insights. These page narratives are created and designed by dashboard authors to provide business users with the most relevant information based on the underlying data and filters applied. The summaries can dynamically adjust as users interact with the dashboard, ensuring access to the latest and most pertinent data.
-
Open the dashboard.
-
Click Auto Summary
in the toolbar. -
The page summary displays. In the example below, the chapter is not filtered; it includes all countries.
-
If you update the page by changing a filter selection, the Page Summary disappears. When you redisplay the summary, it is automatically refreshed with the updated data.
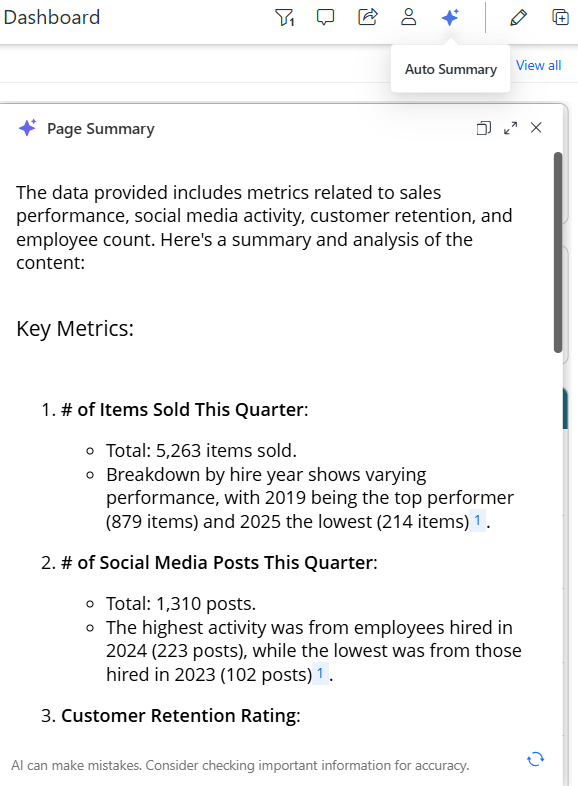
In the example shown below, the chapter filter now includes only the UK. The total number of items sold this quarter is 5,263 versus the 14,331 in the initial summary shown above.
-
If the dashboard author disabled auto refresh, a message displays at the bottom of the Page Summary window indicating that the data has changed. Click Refresh
 to update the summary.
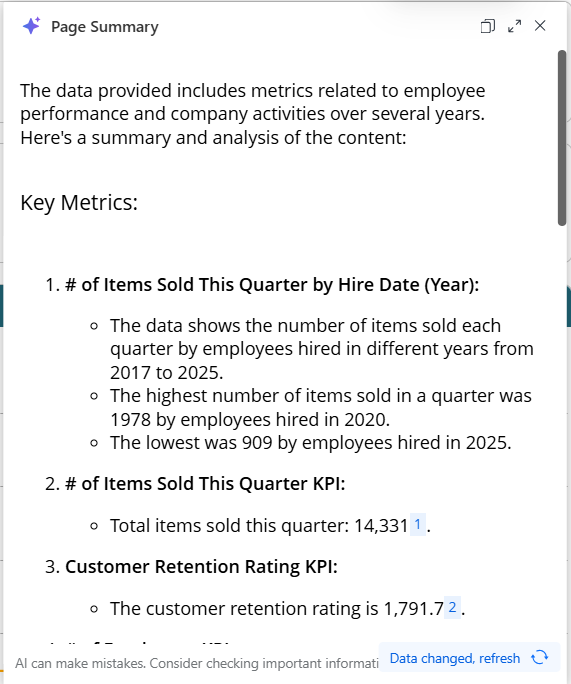
In the example shown below, the chapter filter now includes only the UK, but auto refresh is disabled. The total number of items sold this quarter remains at the initial 14,331. Once you refresh the summary, it recalculates for the UK only.
-
-
To copy the summary with its formatting, click Copy
 in the top right of the Page Summary window.
 -
To expand the summary to fill the page, click Expand in the top right of the Page Summary window. To return it to its original size, click Restore.
-
You can resize the summary. Hover the cursor over the edge of the Page Summary window until the cursor appears as double arrows. Drag the edge of the window to resize it.
-
You can move the summary to display the section underneath it. Hover your cursor over the top of the Page Summary window until the draggable icon displays. Drag the icon to reposition the window.
-
To close the summary, click Close X at the top right of the Page Summary window.
For every auto narrative, there is a corresponding cache containing summary data. The cache is invalidated when the dataset is refreshed or the document definition is modified.