Strategy One
Add Subtotals to a Grid
Starting in Strategy One (November 2025), you can create and display custom subtotals for modern grids.
Starting in Strategy One (November 2025), you can Select the Level for Subtotal Calculation in Modern Grids.
Subtotals reflect data rolled up to different attribute levels on a grid. They can be applied dynamically to any grid. You can apply subtotals using one of many standard predefined subtotal functions such as total, count, minimum, maximum, standard deviation, and others.
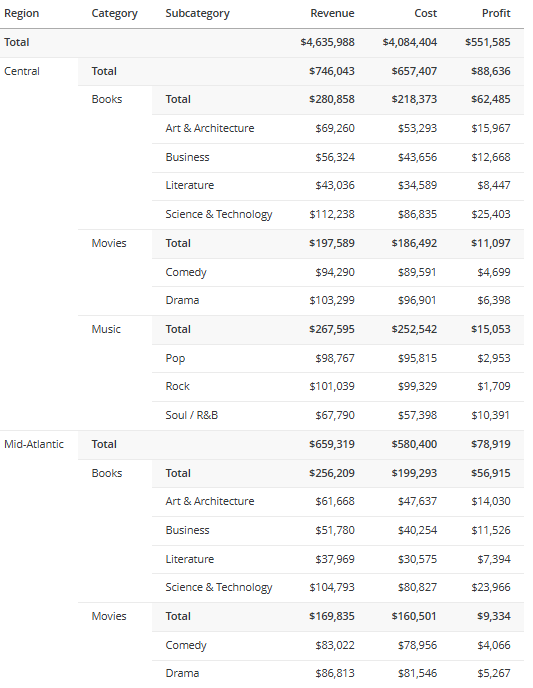
The example grid below contains subtotals and a grand total. It shows subtotals for each category, an additional subtotal for each region (encompassing all categories in the region), and a grand total. This is just a sample of the grid; not all data is displayed in the image below.
Add Subtotals to a Grid
You can add subtotals to grids and modern grids.
- While editing the dashboard, click the grid or modern grid visualization to add subtotals to.
- To subtotal a metric, in the Editor panel or on the grid or modern grid, right-click the metric and select Show Totals.
- To subtotal an attribute, in the Editor panel or on the grid or modern grid, right-click the attribute to its right, point to Show Totals, and select the function such as Total or Average. You can select multiple functions. Click OK.
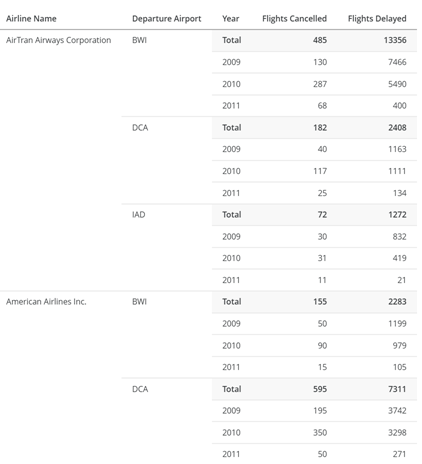
For example, the grid shown below displays the totals for each airline-airport combination. This was accomplished by right-clicking Year to subtotal. To display the totals for each airline, right-click Departure Airport. To display grand totals, right-click Airline Name.
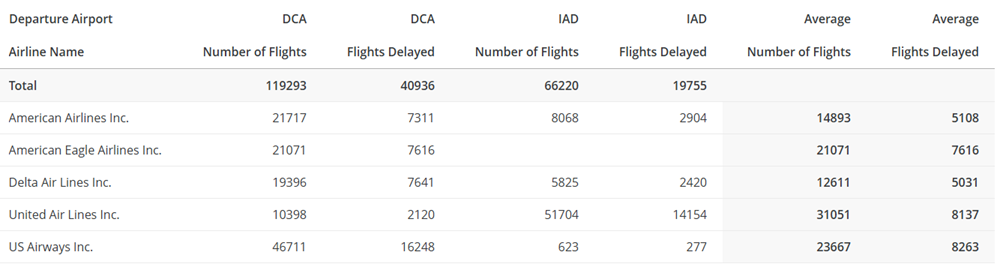
In a modern grid, you can total the rows and/or the columns. For example, the modern grid shown below displays the totals for Airline Name (rows) across the top of the grid. The average for Departure Airport (columns) is shown as a separate column set on the right.
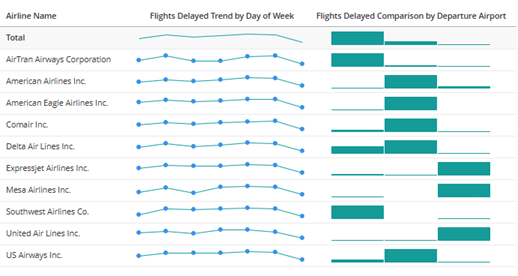
In a modern grid with microcharts, the total displays as the microchart. For example, the sparkline for Flights Delayed by Day of Week and the trend bars for Flights Delayed by Airport are totaled in the following grid:
-
By default, the totals for all metrics display at the top of the grid or modern grid. To move the subtotals to the bottom, right-click the subtotal label in the grid or modern grid, and select Move to Bottom.
- To move the subtotals back to the top, right-click the subtotal label and choose Move to Top.
-
By default, the total for all metrics in a modern grid's columns display in a column set on the right. To move the column set to the left, right-click the subtotal label in the modern grid and select Move to Left. The total column set displays between the attributes in the rows and the first column set.
-
To move the subtotals back to the right, right-click the subtotal label and choose Move to Right.
-
- To toggle between showing or hiding all subtotals, click the Show Totals icon
 in the Editor panel.