Strategy ONE
Question Construction Best Practices
By asking the right questions when using Auto Answers
| Analytic Type | Visualization | Keywords | Key Component | Sample Question |
|---|---|---|---|---|
| Ranking analysis
|
Bar chart |
ranking top/bottom + N rank sort order highest/lowest leaderboard |
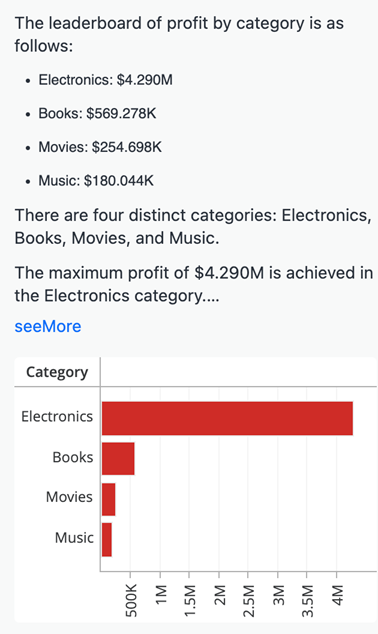
Show a leaderboard of Profit by Category. | |
|
Clustered or stacked bar chart |
All the keywords mentioned above for a bar chart. break by key component (attribute/metric) |
Break by attribute/metric |
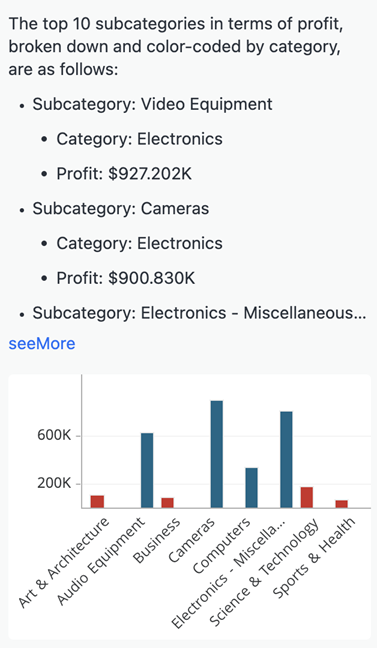
Show the top 10 Subcategory in Profit , break by and color by Category. |
|
| Trend analysis
|
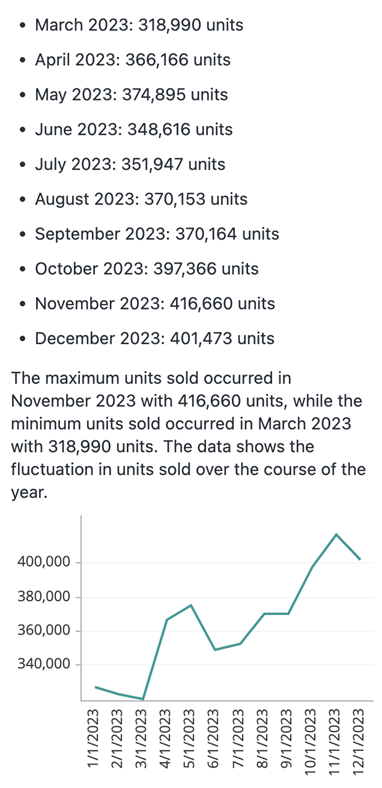
Line chart |
over time over the past… year over year timeframe |
Time attribute x 1 | |
|
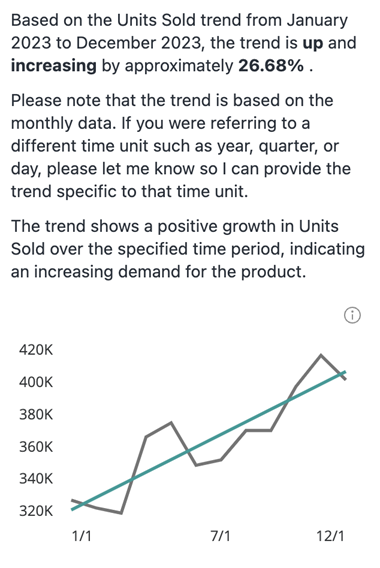
Line chart with trend |
All the keywords mentioned above for a line chart. trend |
Time attribute x 1 |
||
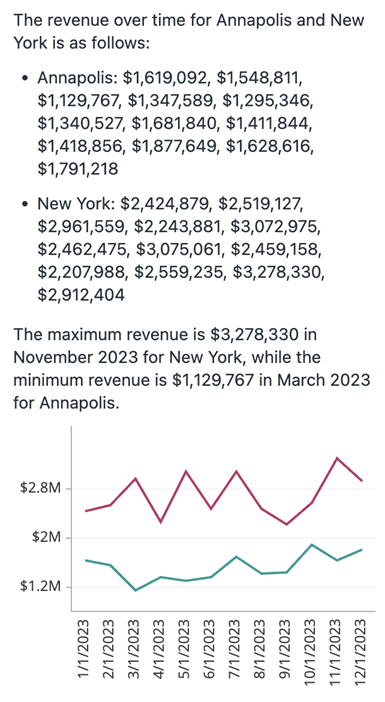
| Multi-line chart |
All the keywords mentioned above for a line chart break by key component (attribute/metric) |
Time attribute x 1 and break by attribute/metric | Show Revenue over time, break by Annapolis and New York. | |
|
Relationships |
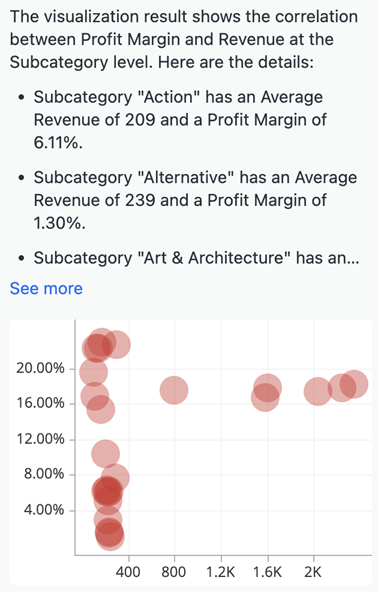
Bubble or scatter chart |
relation correlation pattern
|
metric x 2 |
|
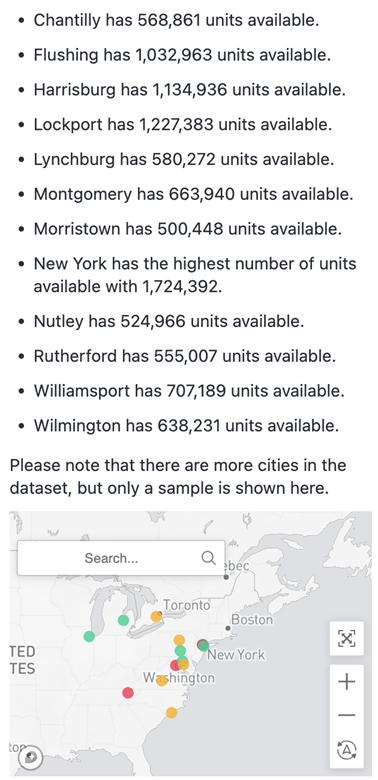
| Location-based analysis | Geospatial service (uses Mapbox) | map | geo attribute | Show a map for Units Available by City. |
|
Distribution analysis |
Pie chart |
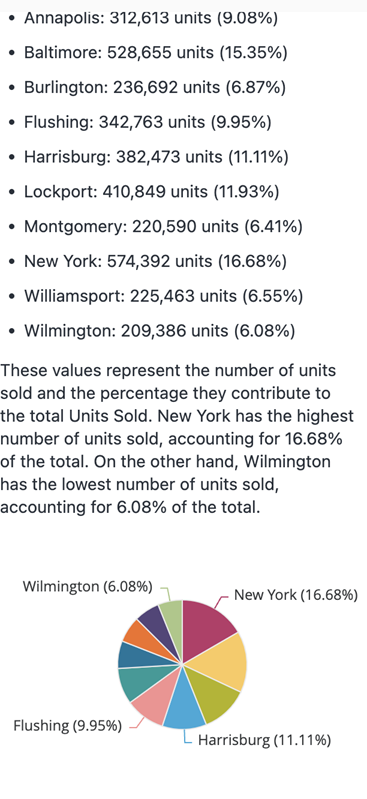
distribution proportion percentages of percentages against whole compare to the total fraction comparison |
|
How does Units Sold in the top 10 cities compare to the total Units Sold? |
| Heat map |
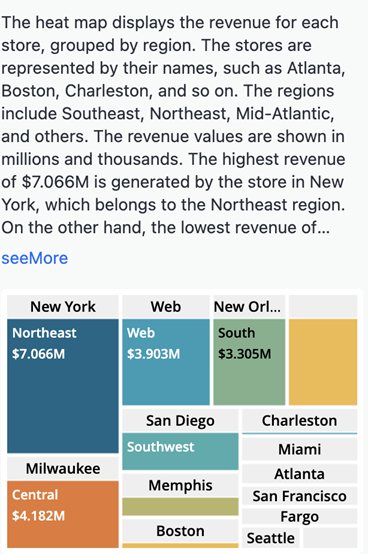
size by group by |
Display a heat map with Store, sized by Revenue . | ||
|
Descriptive statistics (default) |
Bar chart |
If a question doesn’t fall into any above types and necessitates a response beyond mere text use the following keywords: draw a visualize compare show me charts show me a graph |
|
Example Answers
The following examples display the answers to the questions asked in the table above.
Bar Chart
Clustered Bar Chart
Line Chart
Line Chart with Trend
Multi-line Chart
Bubble Chart
Geospatial Service (Mapbox)
Pie Chart
Heat Map
Bar Chart
