Strategy One
Add Information Windows
You can add information windows to your dashboard to enhance the visual interactivity for the user. Information windows allow you to include additional context that is critical to the data point without overcrowding the canvas, because the content displays in a pop-up window on top of your dashboard.
Click an object in a visualization to open an information window, which is filtered by the selected object. You can also open an information window from an image or a text box. The information window can display visualizations, text boxes, images, panels—any dashboard object.
Check out the video below to learn more!
Starting in Strategy One (September 2025), you can add a selector window to enhance the filtering experience. Selector windows can display multiple filters and selectors, so end users can easily view all their choices in one place. End users can also modify multiple filters in bulk and apply all the selections at once. For steps and an example, see Create a Selector Panel or Window.
Create an Information Window
- In the top toolbar, click Information Window
 and select Information Window.
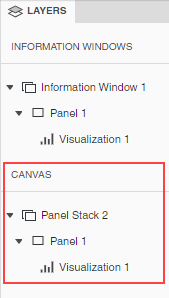
A blank information window, containing a blank grid, displays on the dashboard page. In the Layers panel, a new section has been added for information windows. The rest of the dashboard objects are shown in the Canvas section. You can return to the dashboard canvas by selecting an element under Canvas in the Layers panel.
- To change the visualization type of the default grid, right-click the grid and select Change Visualization. You can also delete it if you do not want a visualization on the panel.
-
Add visualizations, text boxes, images, panel stacks, and other dashboard objects to your information window.
-
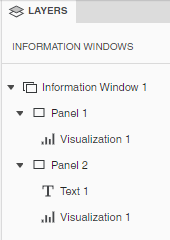
An information window initially contains a single panel, or layer of data. You can add more panels to the information window to provide more layers of data. In the example below, Information Window 1 contains two panels.
The information window elements display in the Information Windows section in the Layers panel. Navigate to a specific element by selecting it.
Select the trigger for the information window
-
From the dashboard canvas, select a visualization, text box, or image that should trigger the information window. This is also referred to as the source of the information window.
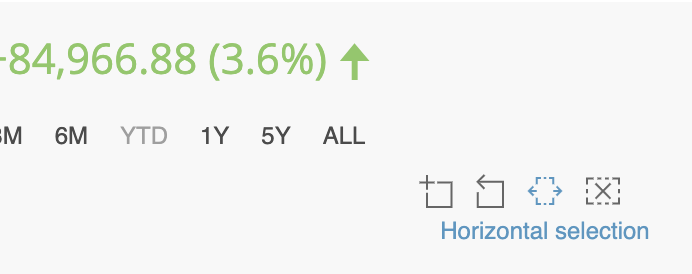
To trigger an information window for a Time Series visualization, use the horizontal selector to choose your desired data point(s). This includes a range of 1 to pass one data point.
-
In the upper right corner of the source object, click More
 and choose Select Information Window.
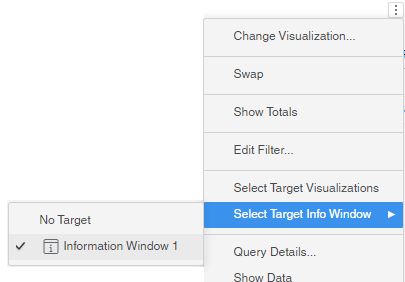
-
Select the information window.
When you click on the source visualization, text box, or image, the information window displays, filtered for the element selected in the source.
Filter the information window
An information window is automatically filtered by the selected data point. You can control whether in-canvas filters and visualizations as filters that target the source are also applied to the information window.
-
If you want to pass the filters, in the Layers panel, right-click the information window and select Apply Additional Filter Conditions.
Now, when you click on the source visualization, text box, or image, the information window displays, filtered for the element selected in the source and by the filters that target the source.
Format the information window
- To format the information window and its title, container, and other elements, in the Layers panel, right-click the information window and select Format.
-
In the Format panel, click the Info Window Options icon
 .
.
-
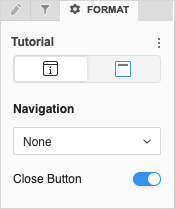
If the information window contains more than one panel, you can define the navigation between the panels. By default, users scroll through the panels using arrow icons that display when they hover their cursor over the panel. The Navigation is set to None. From the Navigation drop-down list, select whether to display panel tabs at the top or bottom of the panel stack.
-
Users close the information window by clicking outside of it. You can add a Close button to control how your users dismiss the information window. To do this, enable Close Button.
-
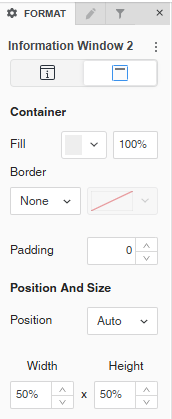
In the Format panel, click the Title and Container icon
 .
. 
-
You can:
- Select the Fill color and its transparency.
- Select a Border style and color.
-
Beginning in Strategy One (September 2025), you can adjust the Radius of rounded corners for the information window container.
-
Use a number between 0 and 40.
-
If the current Padding is less than 50% of the updated Radius, Padding automatically increases to match 50% of the new Radius.
-
- Beginning in Strategy One (July 2025), you can adjust the Padding around the information window container. Use a number between 1 and 100.
-
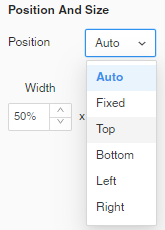
Control the Position of the information window when it is triggered.
The Left, Right, Top, and Bottom positions are in relation to the selected data point. If there is not enough space in the specified position based on the selected point, the information window will automatically display in a position where there is enough space.
- Define the size of the information window by setting the Width and Height.
- Right-click the panel to format and select Format Panel, or select the panel in the Layers panel.
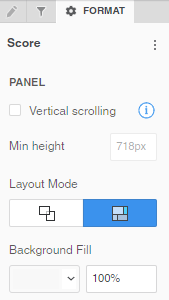
- You can:
- Enable or disable Vertical Scrolling.
- If vertical scrolling is enabled, set the Minimum Height
- Change the Layout Mode between free-form and auto.
- When free-form layout is selected, choose whether to Stretch the Elements
 to fill the page or Expand the Canvas
  to add more content to the page without resizing the existing canvas.
 Use free-form layout to organize and overlap the visualizations, filters, selectors, images, HTML, and other objects. You can independently position, size, and layer containers on the panel.
Use auto layout to automatically fill the panel's screen area with the objects. The objects can be repositioned around each other.
Each panel on a panel stack can use a different layout type for maximum flexibility.
- When free-form layout is selected, choose whether to Stretch the Elements
- Add a Background Fill and set the transparency.
Starting in Strategy One (September 2025), you can adjust the padding in Automatic Layout.
- Enable or disable Vertical Scrolling.
Format a panel
Each panel can be formatted independently.