Strategy One
How to View a Report as a Grid: Grid View
A grid report displays report results in a format similar to a spreadsheet. Grid view provides an effective display to analyze details of your business data.
You can go to specific pages in a grid report, and you can determine how many rows or columns are displayed at one time. You can also search for an object to add to the report. See the appropriate steps below for information.
To View a Report in Grid view
- Click the name of a report to execute it.
- Click the Grid
icon
 on the toolbar.
To Set the Number of Rows and Columns that are Displayed
- On the upper right of any page, click your user name, and then select Preferences from the drop-down list.
- From the left, select Grid display.
- In the Maximum rows in grid field, enter the maximum number of rows you want to see on your report. The maximum number of rows you can set is 9,999.
- In the Maximum columns in grid field, enter the maximum number of columns that you want to see on your report. The maximum number of columns you can set is 9,999.
- Click Apply.
The Maximum rows and columns settings specified above can be overridden by a setting in MicroStrategy Developer called Maximum number of XML cells. For more information, contact your administrator.
To Search for an Object to Add to the Report
To add an object to the report, you must have the necessary Web Professional privileges to create a report.
-
Hover between the columns where you want to add the object. A pop-up Search field is displayed.
If a pop-up Search field is not displayed, the Search from report grid view option is disabled. An administrator can enable the Search from report grid view option.
- By default, all attributes, consolidations,
custom groups, hierarchies, and metrics are searched. To change which
types are searched, do the following:
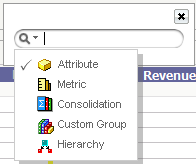
Click the Search icon
 to display
a list of object types, as shown below:
- Select the object types to search.
- Click in the Search field to close the object type list.
- Type the object name in the Search field, and then select from the results. The selected object is added to the report between the columns.
Related Topics
How to View a Report as a Graph: Graph View
