MicroStrategy ONE
Adding JMX Support to a MicroStrategy Identity Installation
Java Management Extensions (JMX) technology provides tools to monitor and manage your applications. Adding JMX support to the installation allows your monitor tool to consume exposed Internet of Things (IOT)-related performance stats via JMX.
This feature is based on the existing performance monitor tool by MicroStrategy. A group of API's stats are exposed if they are called. To check the stats you can launch the JConsole and Java.jvisualvm tools which are shipped separately with Java. You will be able to view Mbean using JConsole without additional configuration, however Java.jvisualvm Mbean browser plugins must be installed to view Mbean with this tool. You will also need your own monitor tool to consume the data.
It is recommended that you change the JMX default password before use. The password is saved in the following file:
-Dcom.sun.management.jmxremote.password.file=$CATALINA_BASE/conf/jmxremote.password
Consult this Oracle help to learn more details about password changes.
Configuration
Configuring JMX counters on a Linux environment
JMX monitor access is automatically enabled in a Linux MicroStrategy Identity default installation. The following parameters are set by default in the MicroStrategy Identity Server startup script:
<usher installation>/usherserver/usherApps/shardIDM/bin/tomcat.sh.
If you choose to edit these parameters, please refer to Oracle documentation for JVM configuration parameters.
The default MicroStrategy Identity Server startup script will include:
-Dcom.sun.management.jmxremote
-Dcom.sun.management.jmxremote.port=5500
-Dcom.sun.management.jmxremote.ssl=false
-Dcom.sun.management.jmxremote.authenticate=true
-Dcom.sun.management.jmxremote.password.file=$CATALINA_BASE/conf/jmxremote.password
-Dcom.sun.management.jmxremote.access.file=$CATALINA_BASE/conf/jmxremote.access
Configuring JMX counters on a Windows environment
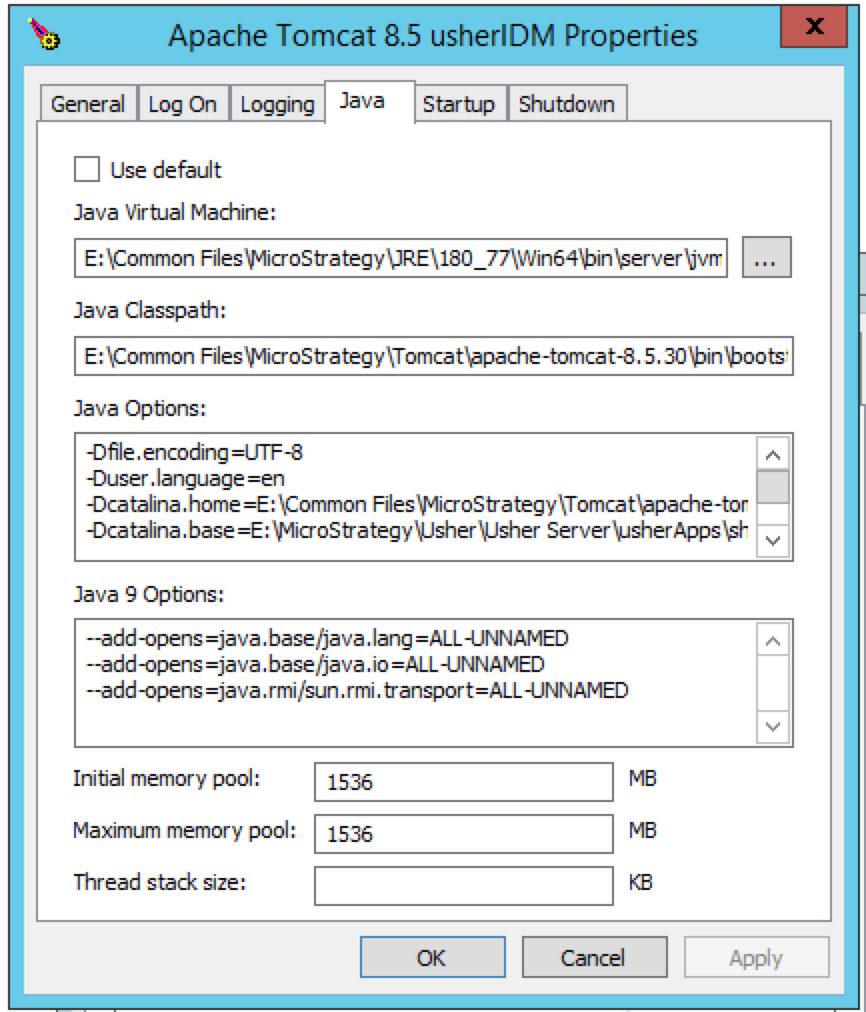
On a Windows MicroStrategy Identity default installation, JMX monitor access is not automatically enabled and requires manual operations using the MicroStrategy Identity Server service configuration utility. Follow the settings below to manually configure JMX monitor access on your Windows machine:
If you choose to edit these parameters, please refer to Oracle documentation for JVM configuration parameters.
The parameters for JMX will be appended to the "Java Options" section of the MicroStrategy Identity Server service configuration utility.
How to use the MicroStrategy Identity Server JMX counters
If the JMX Client tool and the MicroStrategy Identity Server (Java process) are on the same machine, please use the local process. Otherwise, please use the JMX connection.
JMX counters are "lazy loading", so they will only appear on your JMX Client once the API(s) have been exercised.
Below are examples of how to use two of the supported metrics.
Using the MicroStrategy Identity Server JMX counters with JConsole
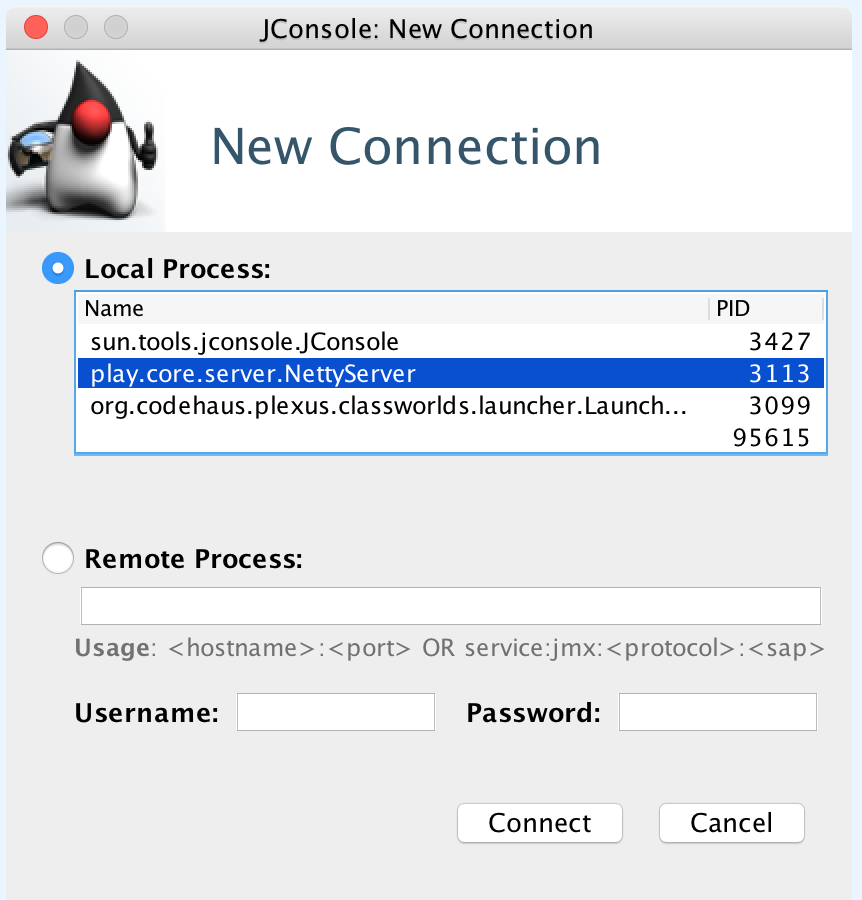
- Connect to JConsole using the local process:
- Select the Mbeans tab after connecting and expand the metrics folder on the left.
- After the SiginIn API is called, you can see the stats by selecting Attributes under the fully qualified method name:
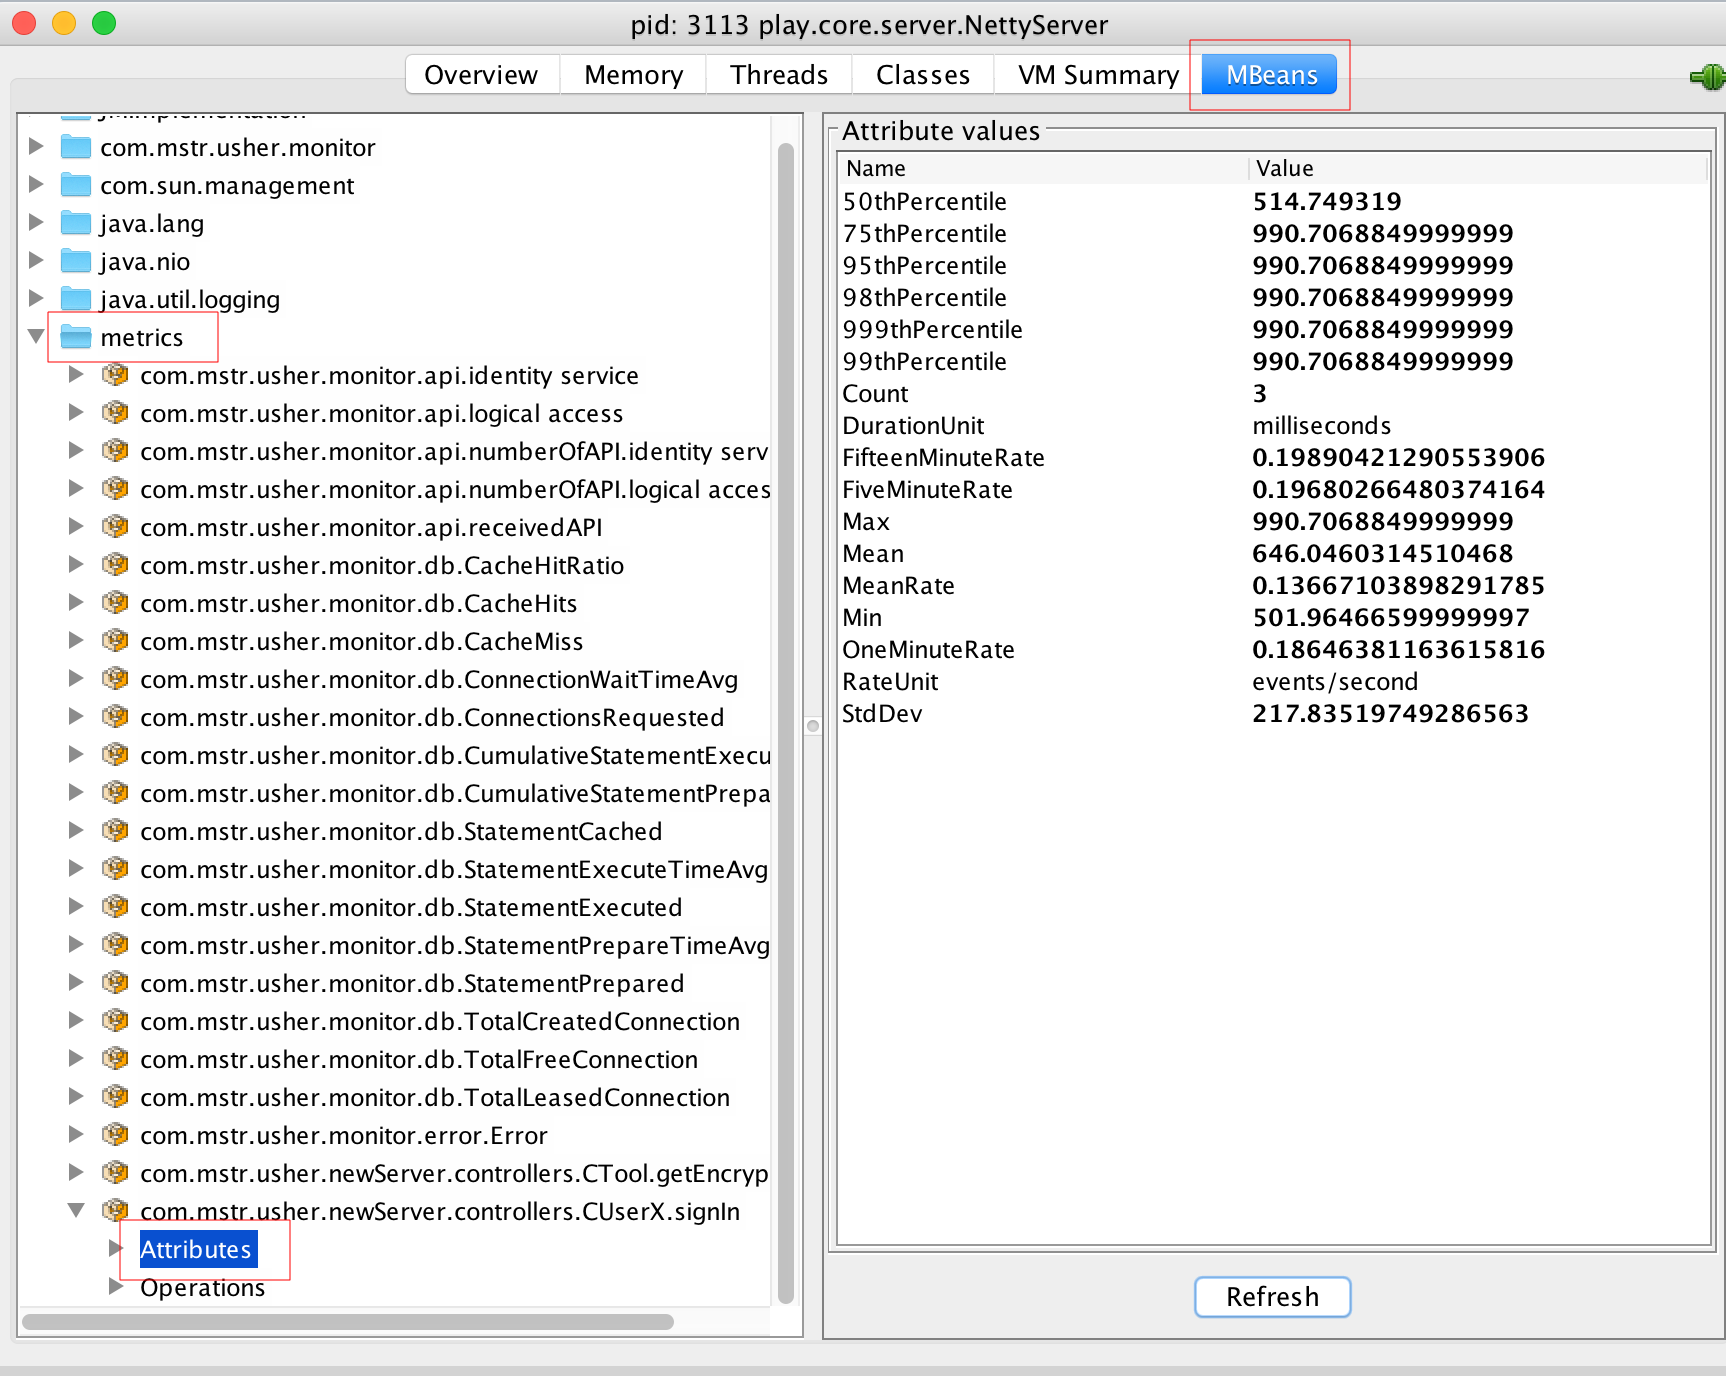
Other attributes like com.mstr.usher.monitor.api.receivedAPI, how many APIs are received, and com.mstr.usher.monitor.error.Error, (how many errors or non-200 response) are also provided.
Using the MicroStrategy Identity Server JMX counters with jvisualvm
- In the VisualVM menu, click Tools > plugins:

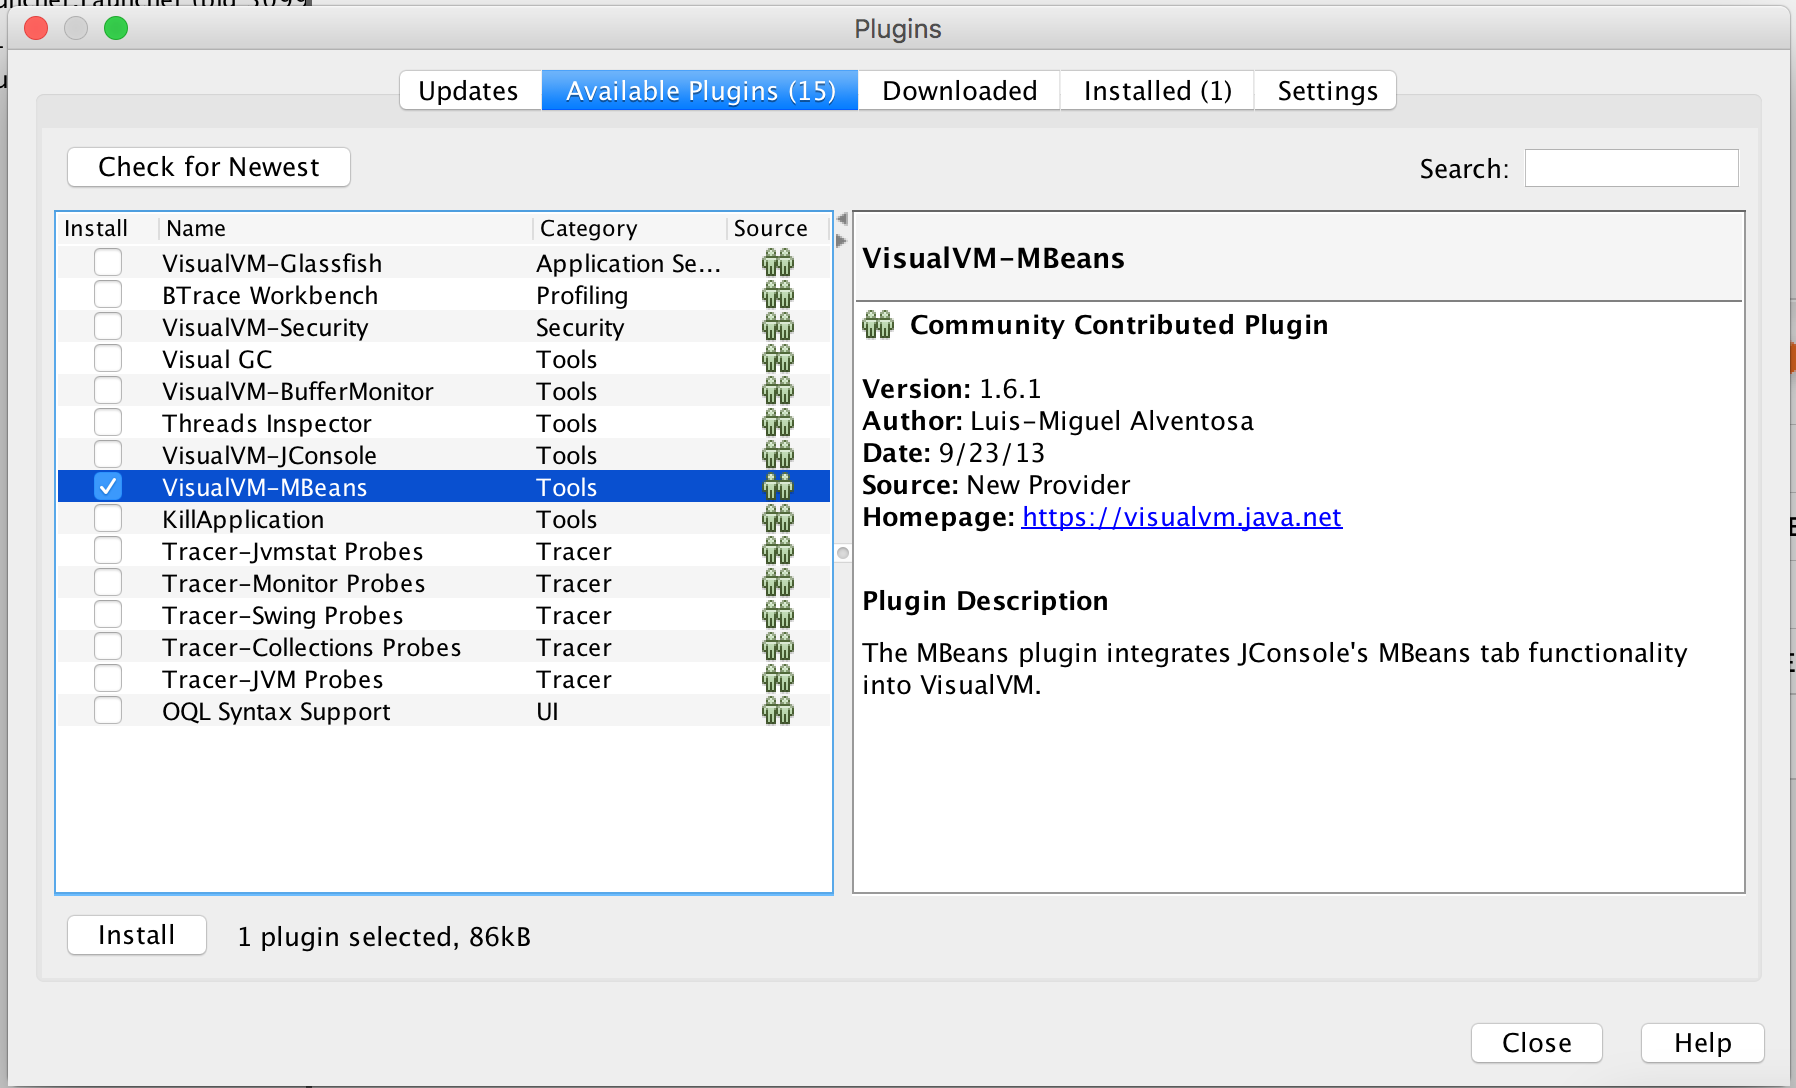
- Select Available Plugins > VisualVM-MBeans:
If no plugins appear, select the Settings tab and provide one of the URLs listed here. Your specific URL will be located next to your JDK version.
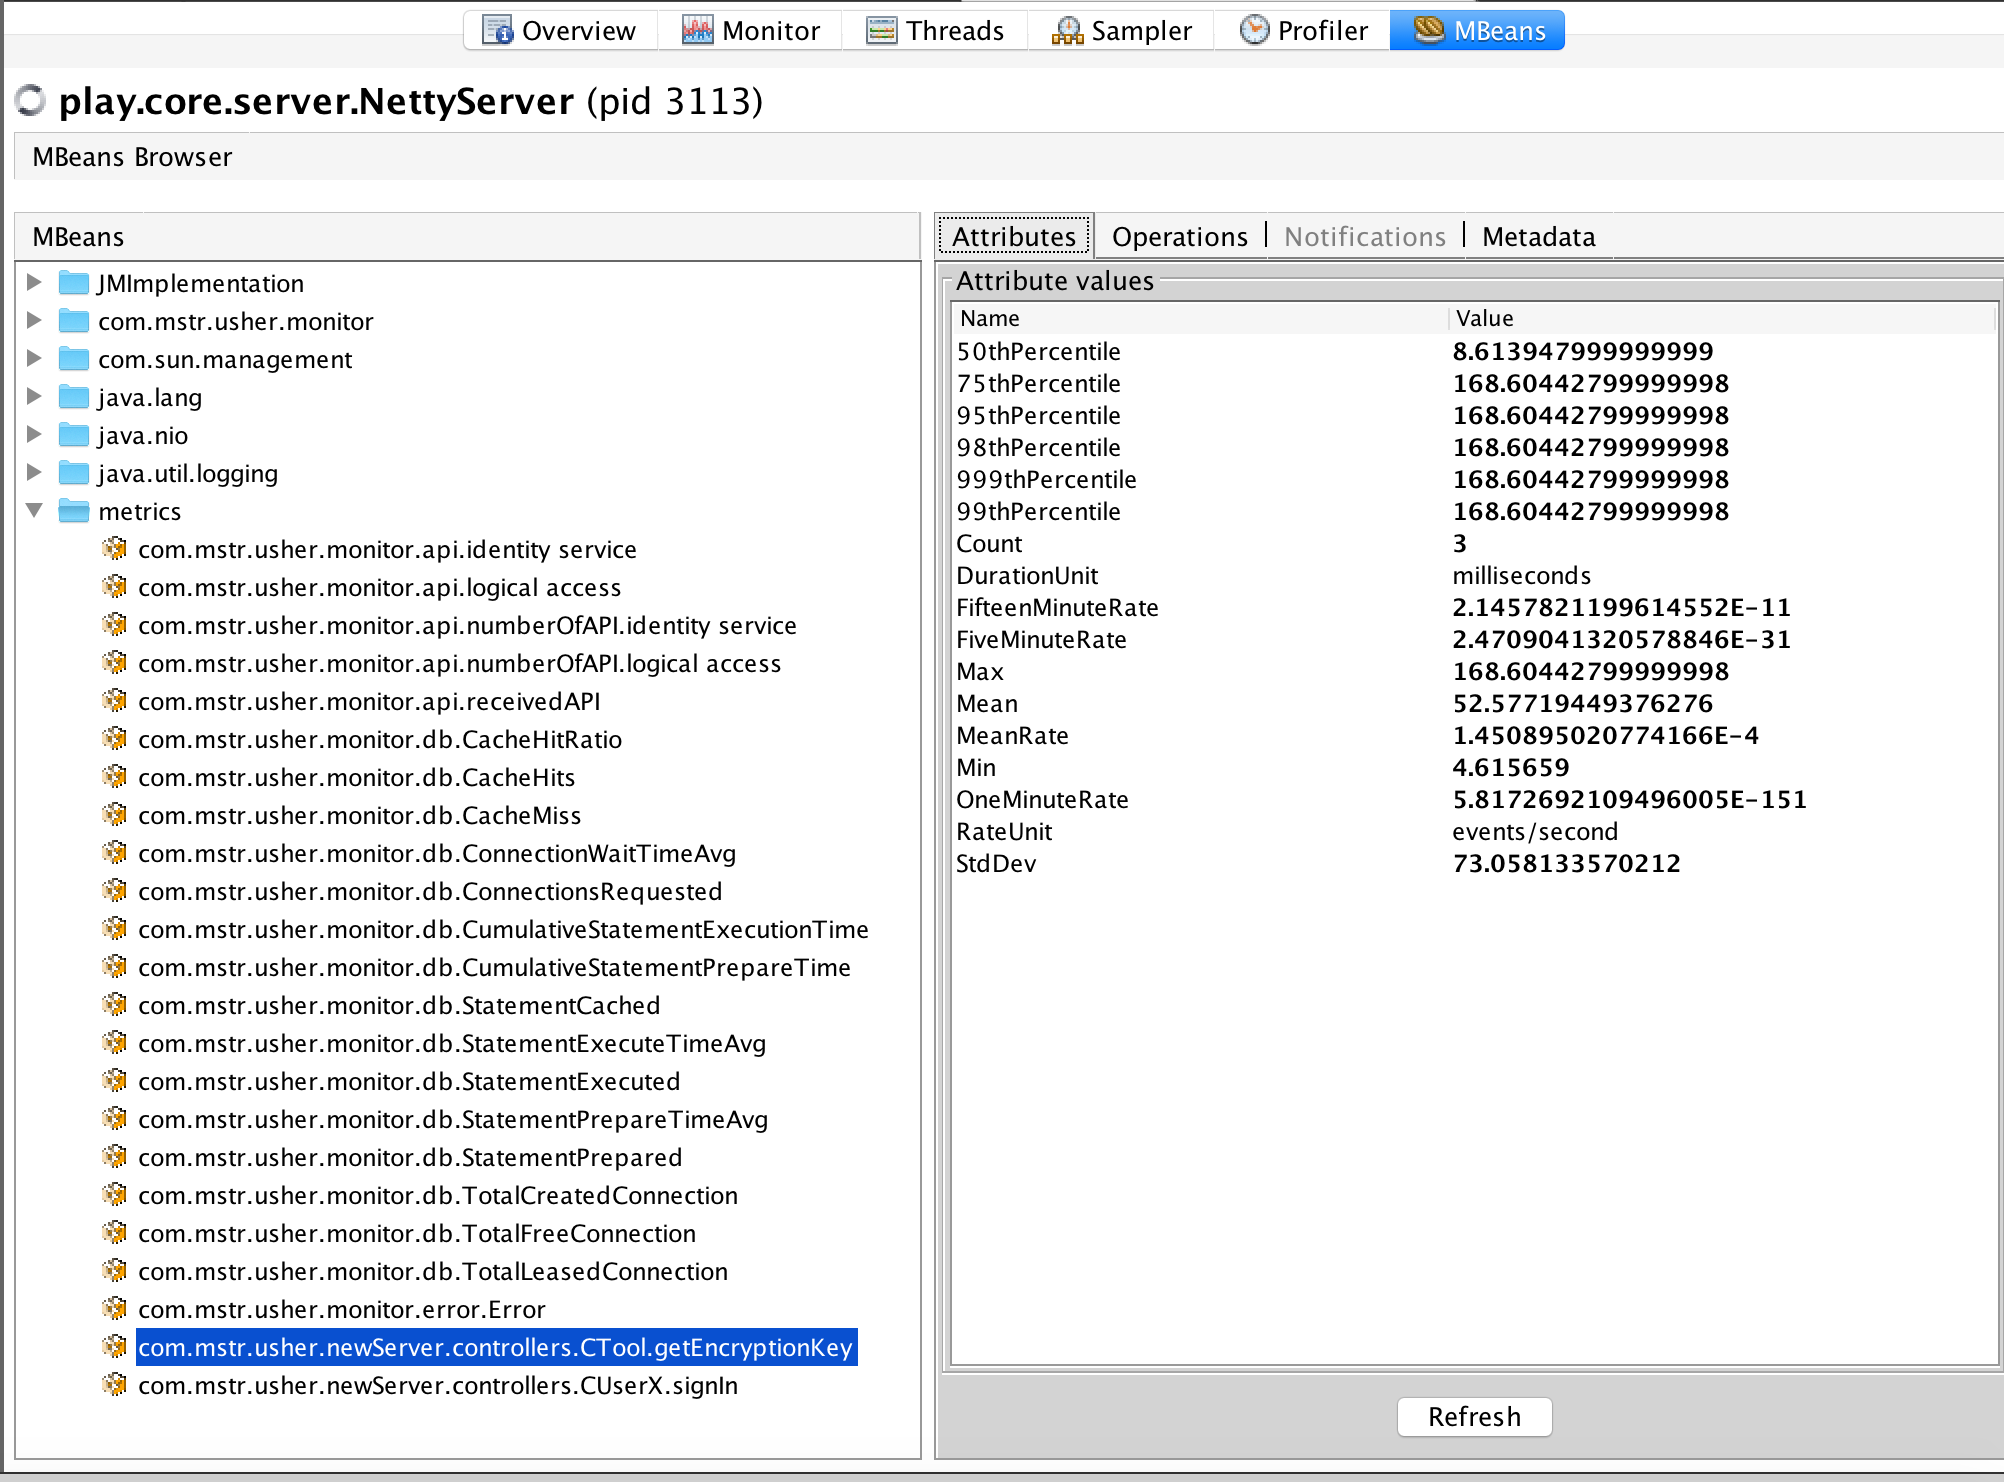
- Now, you can check the status under the MBeans tab:
