Strategy ONE
PercentRankRelative
This function is used to display the ranking of values as a percentage, with the ranking based on a secondary data set. For example you can rank the current year's profit for a particular region based on (relative to) the profit from the previous year.
The calculation can restart based on attributes identified in the parameter settings. This is an OLAP function.
You can also rank values in the following ways:
- The
Rankfunction (see Rank ) ranks values as an integer value. For example, you can rank profit for five categories from 1 to 5. - The
PercentRankfunction (see PercentRank ) ranks values as a percentage based on those values as the data set. For example, you can rank profit for a particular region based on the profit for all regions.
Syntax
PercentRankRelative <inclusive, rankOutliers, significance, truncate, BreakBy> (Argument, Rank)
Where:
Argumentis a fact or metric representing a list of numbers that are to be ranked.Rankis a fact or metric representing a list of numbers that are used to determine the rank of the values provided withArgument. The values for Rank should be within the same range as the values ofArgumentto provide a relevant ranking. For example, using profit values to rank revenue would rarely result in relevant results, as profit is likely to have a different range of values than Revenue. However, using last year's profit to rank this year's profit can provide relevant results as the profits between last year and this year are more likely to be in the same range of values.inclusiveis aTRUE/FALSEparameter that indicates whether the rank is inclusive or exclusive:TRUE(default): The percent rank is in a range from 0 to 1 inclusive. This means that 0% and 100% are included.FALSE: The percent rank is in a range from 0 to 1 exclusive. This means that 0% and 100% are excluded.
rankOutliersis aTRUE/FALSEparameter that indicates whether outlier values are included in the calculation:TRUE: Values fromRankthat are outside of the range of values fromArgumentare included in the ranking. This often results in showing values such as 100% or 0%.FALSE(default): Values fromRankthat are outside of the range of values fromArgumentare not included in the ranking. The results are left blank rather than showing a percentage.
significance(default is 3) determines the number of digits that are used to perform each calculation. You can provide any integer value from 1 to 9 for this parameter.truncateis aTRUE/FALSEparameter that indicates whether the final result is rounded or truncated:TRUE(default): The final result is truncated, based on the significance applied to the calculation. For example, using the default ofsignificance=3, the fourth digit is dropped and is not used to round the third digit.FALSE: The final result is rounded, based on the significance applied to the calculation. For example, using the default ofsignificance=3, the fourth digit is used to round the third digit.
BreakByis the parameter that designates where the calculation should restart.
Example
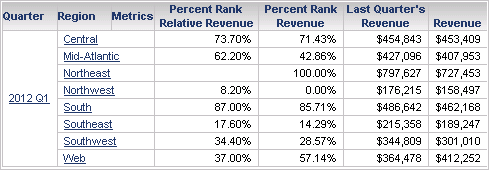
The example report shown below displays revenue information across regions for a given quarter. You can use PercentRankRelative to return the rank of revenue for each region during a given quarter, relative to last quarter's revenue.
The definition for the Percent Rank Revenue metric in this example is:
PercentRankRelative<BreakBy={Quarter}>(Revenue, [Last Quarter's Revenue])

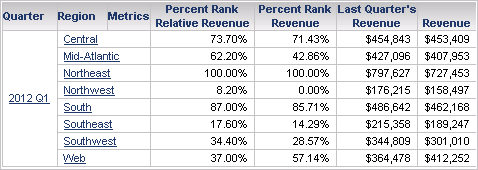
The Percent Rank Relative Revenue metric in the report shown above provides the rank of each revenue value. The highest value in the Northeast region displays no data because last quarter's revenue is $797,627, which is greater than any revenue value for this quarter and thus outside of the range of values. Since the default for the function is to not rank outlier values, no data is displayed. If you modify the rankOutlier parameter to be rankOutlier=TRUE, then data is returned for this ranking as shown in the report below.

This report also includes a metric that uses the PercentRank function, ranking the revenue based on its own values. For information on PercentRank and an explanation of these results, see PercentRank .
