Strategy ONE
Forecasting Example
The report and report components in this example can be found in the MicroStrategy Tutorial project in the following folder: MicroStrategy Tutorial\Public Objects\Reports\ MicroStrategy Platform Capabilities\Advanced Analytics\ Statistics and Forecasting\Forecasting
How to Forecast Future Sales Based on Existing Sales Data?
The MicroStrategy Tutorial project has sales data for multiple years. Using this data, you can forecast potential sales for the upcoming years.
To plot a sales line for the expected future sales data, apply linear extrapolation techniques to the historical data. Linear extrapolation involves the assumption that the trend of past data will continue in a linear fashion. The slope and Y-intercept values are calculated based on historical data, and the same slope and Y-intercept are applied to extend the data into the future.
This is just one type of forecasting analysis that can be done in MicroStrategy. There are additional MicroStrategy functions that provide other variations on calculating a forecast of values. For information on these functions, how they forecast values, and forecasting examples using these functions, see:
To perform the analysis, build a set of metrics that calculate each of the components in the analysis, then use those metrics together to create the final Forecasting metric.
- The metric that calculates sales revenue at the Year level is defined as follows:
Revenue {Year} = Sum(Revenue) {~+, Year+}
- The metric that expresses the Year elements as a series of integers, to simplify the analysis, is defined as follows:
YearNumber = RunningSum<SortBy= (Year@ID) >(Sum(1) {~+, Year } )
- The metric that calculates the slope of the line produced by the Revenue {Year} metric is defined as follows:
SlopeMetric= Slope([Revenue {Year}], YearNumber) {~+, !Year+} - The metric that calculates the Y-intercept of the line produced by the Revenue {Year} metric is defined as follows:
InterceptMetric = Intercept([Revenue {Year}], YearNumber) {~+, !Year+} -
The final metric combines the three preceding metrics into a forecast value. This formula follows the standard formula for a line:
y = mx + b. The metric is defined as follows:Forecast = ((SlopeMetric * YearNumber) + InterceptMetric)
Place the Forecast metric on a report with Year. A sales forecast is generated for all available years. The Forecast (Graph) report displays as follows:
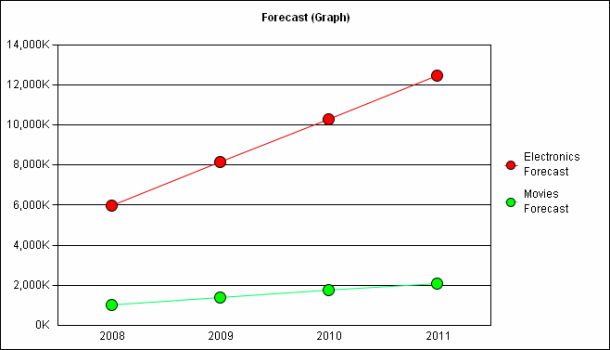
The sales for 2008, 2009, and 2010 are actual recorded values, and the sales for 2011 are a linear extrapolation of the existing data into the future.
The following SQL is generated for the Forecast (Graph) report:
Pass0 -  Execution Duration: 0:00:00.20
create table ZZT16JMSID1MD000 (
	YEAR_ID SHORT,
	CATEGORY_ID SHORT,
	WJXBFS1 DOUBLE)
Pass1 -  Execution Duration: 0:00:00.10
insert into ZZT16JMSID1MD000
select a11.[YEAR_ID] AS YEAR_ID,
	a11.[CATEGORY_ID] AS CATEGORY_ID,
	a11.[TOT_DOLLAR_SALES] AS WJXBFS1
from [YR_CATEGORY_SLS] a11
Pass2 -  Execution Duration: 0:00:00.23
select a12.[YEAR_ID] AS YEAR_ID,
	a11.[CATEGORY_ID] AS CATEGORY_ID,
	1.0 AS WJXBFS1
from [LU_CATEGORY] a11,
	[LU_YEAR] a12
Pass3 -  Execution Duration: 0:00:00.00
create table ZZT3M2QSNWDMD001 (
	YEAR_ID SHORT,
	CATEGORY_ID SHORT,
	WJXBFS1 DOUBLE)
Pass4 -  Execution Duration: 0:00:00.00
[Analytical SQL calculated by the Analytical Engine:
	select YEAR_ID,
		CATEGORY_ID,
		RunningSum<SortBy= ([YEAR_ID])>(WJXBFS1)
	from [previous pass]
]
Pass5 -  Execution Duration: 0:00:00.00
insert into ZZT3M2QSNWDMD001 values (2008, 1, 1)
Pass6 -  Execution Duration: 0:00:00.00
create table ZZTDMBESMXPOJ002 (
	YEAR_ID SHORT,
	CATEGORY_ID SHORT)
Pass7 -  Execution Duration: 0:00:00.00
insert into ZZTDMBESMXPOJ002
select pa11.[YEAR_ID] AS YEAR_ID,
	pa11.[CATEGORY_ID] AS CATEGORY_ID
from [ZZT16JMSID1MD000] pa11
Pass8 -  Execution Duration: 0:00:00.00
insert into ZZTDMBESMXPOJ002
select pa11.[YEAR_ID] AS YEAR_ID,
	pa11.[CATEGORY_ID] AS CATEGORY_ID
from [ZZT3M2QSNWDMD001] pa11
Pass9 -  Execution Duration: 0:00:00.00
create table ZZT9MCAB4STOD003 (
	YEAR_ID SHORT,
	CATEGORY_ID SHORT)
Pass10 -  Execution Duration: 0:00:00.00
insert into ZZT9MCAB4STOD003
select distinct pa11.[YEAR_ID] AS YEAR_ID,
	pa11.[CATEGORY_ID] AS CATEGORY_ID
from [ZZTDMBESMXPOJ002] pa11
Pass11 -  Execution Duration: 0:00:00.00
select pa11.[YEAR_ID] AS YEAR_ID,
	pa11.[CATEGORY_ID] AS CATEGORY_ID,
	pa12.[WJXBFS1] AS WJXBFS1,
	pa13.[WJXBFS1] AS WJXBFS2
from [ZZT9MCAB4STOD003] pa11,
	[ZZT16JMSID1MD000] pa12,
	[ZZT3M2QSNWDMD001] pa13
where pa11.[CATEGORY_ID] = pa12.[CATEGORY_ID] and
	pa11.[YEAR_ID] = pa12.[YEAR_ID] and
	pa11.[CATEGORY_ID] = pa13.[CATEGORY_ID] and
	pa11.[YEAR_ID] = pa13.[YEAR_ID]
Pass12 -  Execution Duration: 0:00:00.00
create table ZZTMYCAAR65MD004 (
	CATEGORY_ID SHORT,
	WJXBFS1 DOUBLE,
	WJXBFS2 DOUBLE)
Pass13 -  Execution Duration: 0:00:00.00
[Analytical SQL calculated by the Analytical Engine:
	select CATEGORY_ID,
		Slope(WJXBFS1, WJXBFS2),
		Intercept(WJXBFS1, WJXBFS2)
	from [previous pass]
]
Pass14 -  Execution Duration: 0:00:00.00
insert into ZZTMYCAAR65MD004 values (1,
	58938.0812500116, 585341.077083335)
Pass15 -  Execution Duration: 0:00:00.04
select pa11.[CATEGORY_ID] AS CATEGORY_ID,
	a13.[CATEGORY_DESC] AS CATEGORY_DESC0,
	pa11.[YEAR_ID] AS YEAR_ID,
	(IIF(ISNULL((pa12.[WJXBFS1] * pa11.[WJXBFS1])), 0,
	(pa12.[WJXBFS1] * pa11.[WJXBFS1])) +
	IIF(ISNULL(pa12.[WJXBFS2]), 0, pa12.[WJXBFS2])) AS
	WJXBFS1
from [ZZT3M2QSNWDMD001] pa11,
	[ZZTMYCAAR65MD004] pa12,
	[LU_CATEGORY] a13
where pa11.[CATEGORY_ID] = pa12.[CATEGORY_ID] and
	pa11.[CATEGORY_ID] = a13.[CATEGORY_ID]
Pass16 -  Execution Duration: 0:00:00.00
[Populate Report Data]
Pass17 -  Execution Duration: 0:00:00.00
drop table ZZT16JMSID1MD000
Pass18 -  Execution Duration: 0:00:00.00
drop table ZZT3M2QSNWDMD001
Pass19 -  Execution Duration: 0:00:00.00
drop table ZZTDMBESMXPOJ002
Pass20 -  Execution Duration: 0:00:00.00
drop table ZZT9MCAB4STOD003
Pass21 -  Execution Duration: 0:00:00.00
drop table ZZTMYCAAR65MD004
- Pass0 and Pass1 calculate the Revenue {Year} metric.
- Pass2 calculates the inner portion of the YearNumber metric, assigning the integer 1 to each year available in the
LU_YEARlookup table. Note that this metric was defined by adding Year dimensionality with filtering set to None. This forces the metric into its own pass of SQL, to ensure that all years in the lookup table are numbered, not just the years with data in the fact table. - Passes 3 to 14 calculate the metrics YearNumber, SlopeMetric, and InterceptMetric. The Intelligence Server performs the calculations based on the data in the temporary table from Pass0, Pass1, and Pass2. Values are calculated and inserted back into the temporary tables.
- In Pass15, the Forecast metric is calculated based on the information from all of the previous calculations. The
mx+bcalculation is performed as part of the SQL statement. - The remaining passes prepare the report and drop the temporary tables.