MicroStrategy ONE
Reports and Dashboards in Enterprise Manager
Enterprise Manager comes equipped with several preconfigured reports and dashboards that provide insight into your MicroStrategy objects, report processing data, and user and session data. You can use the Enterprise Manager reports and dashboards out-of-the-box, or you can modify the reports to return exactly the data you want to analyze for your MicroStrategy environment. To run a report in the Enterprise Manager project, you connect to the project as you would any of your other projects. Some sample reports and dashboards are shown below. For more information on the available out-of-the-box reports and dashboards, see the Reporting in Enterprise Manager section of the Enterprise Manager Help.
Project Analysis (Interactive) Dashboard
This dashboard provides usage information for a project, including object storage, patterns in project growth, and a list of unused application objects for cleanup.
- The Overview portion provides a general view of project performance and project size.
- The Growth portion provides details about new application objects added to the project.
- The Usage portion provides a picture of the most frequently used objects in the project.
- The Clean Up portion provides a view of unused objects in the project.

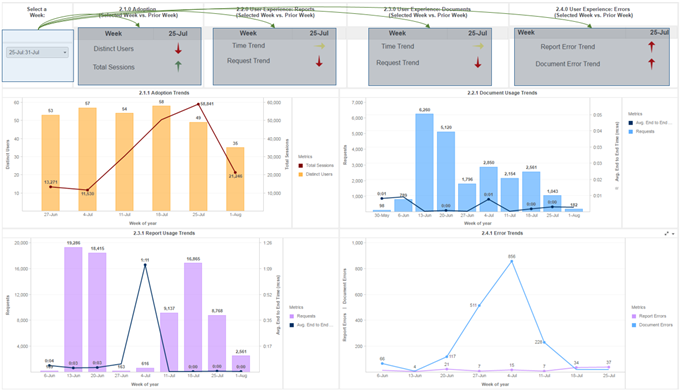
KPIs
Select a week from the top left selector. The top row of grids display KPI trends for the selected week compared to the week prior as indicated by an arrow (up/down/no change). Each of these trend indicator grids correspond to a more detailed view of each KPI over time in the four combination charts directly below.
Report Usage Analysis Dashboard
This dashboard provides an overview of report usage and performance in your projects, including average wait times and number of execution errors encountered. The user specifies the period for analysis.
- The Reporting Details portion provides in-depth information on individual reports within a given project. Select a report from the drop-down list.
- The Processing Summary portion provides a general picture of report activity for a given project and Intelligence Server.
Delivery Processing Analysis
This analysis area provides several reports that analyze the Distribution Services subscription activity in your system.
|
Report name |
Function |
|
111. Weekly Subscription Activity |
Provides a comprehensive weekly summary of subscription activity. |
|
112. Subscription Statistics |
Provides subscription activity over a given time interval. This report is prompted on time. |
|
113. User Subscription Statistics |
Provides information for users on subscription execution over a given time interval. This report is prompted on time. |
|
114. Top 10 Subscribed Documents |
Provides insight into the documents that contribute to the top 10 percent of recipients; execution time; or number of subscriptions over a time interval. This report is prompted on time and on which subscription analysis metric to use. |
|
115. Top 10 Subscribed Reports |
Provides insight into the reports that contribute to the top 10 percent of recipients, execution time, or number of subscriptions over a time interval. This report is prompted on time and on which subscription analysis metric to use. |
|
116. Top 10 Subscribed Contacts |
Provides insight into the users that contribute to the top 10 percent of recipients, execution time, or number of subscriptions over a period. This report is prompted on time and on which subscription analysis metric to use. |
|
117. Top 10 Longest Executing Subscriptions |
Lists the top 10 percent of subscriptions that contribute to the execution times over a period. This report is prompted on time. |
User preference analysis
This analysis area provides reports to analyze the effects of user group activity on the system. Administrators can measure the following:
- What groups do specific users belong to?
- What reports are most commonly executed by members of a specific user group?
|
Report name |
Function |
|
90. List User Groups to which users belong |
Lists all user groups to which the specified users belong. This report is prompted on user. |
|
91. Popular reports in a user's User Group |
Lists the top N most-executed reports in a user's user group. This report is prompted on user, time, and number of reports. |
Cube Advisor
The reports in this analysis area give an overview of database execution statistics for report requests. They provide a picture of how measures such as report execution times are affected if reports are run against Intelligent Cubes rather than the data warehouse.
You can use the Database Execution Time of Reports report with Cube Advisor to provide data on the performance benefits of potential Intelligent Cubes, such as any decrease in the time required to execute SQL statements and the number of users that would be affected by the recommended Intelligent Cubes. For information on this report's contents and steps for exporting it and importing into Cube Advisor, see the Dynamic Sourcing chapter in the In-memory Analytics Help.
|
Report name |
Function |
|
46. Report Object Listing |
Provides analysis of the attributes and metrics in a report. This report is prompted on report. |
|
47. Projected Cube Execution Time of Reports |
Projects the execution times of report jobs if they were to hit an Intelligent Cube. This report is prompted on time and on report. |
|
48. Database Execution Time of Reports |
Provides database execution statistics for report requests. This report is prompted on time and on project. You can export this report as an Excel file and then import it to the Cube Advisor. |