MicroStrategy ONE
Dashboards
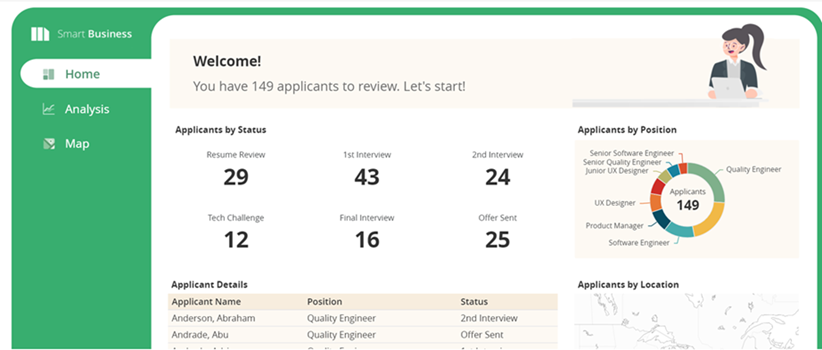
Quickly create a customized, interactive dashboard that can be used to explore business data. Base the dashboard on data in your organization's data warehouse storage; data imported from many different sources, including local files, databases, and Google Drive; or a combination of existing and imported data. Manipulate the data to customize the information that is included in the dashboard. Add visual representations of the data (called visualizations) to make the data easier to interpret. You can view dashboards in MicroStrategy Web, MicroStrategy Library, MicroStrategy Workstation, or on a mobile device using MicroStrategy Mobile. Share a dashboard through email, by linking to the dashboard, or by embedding the dashboard in a web page.

The tasks to create a polished dashboard are streamlined. For example, you can:
- Create visualizations to display the data in multiple ways, then easily modify, rearrange, or resize the visualizations.
-
Add labels, background information, descriptions, instructions, and other text.
-
Add images, such as corporate logos or photos.
-
Group data and objects on panels to allow users to switch between and explore subsets of data.
- Filter the data to allow users to display only the information they are interested in.
-
Automatically format specific data value ranges by color, by creating thresholds.
