MicroStrategy ONE
Example for creating a new report
This section provides tutorials for designing a basic grid report in MicroStrategy Web.
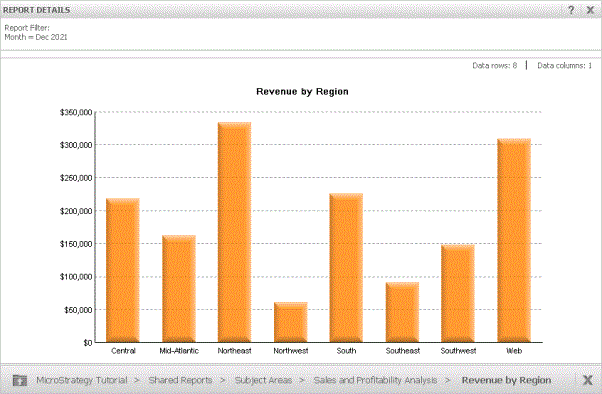
Using the procedure below, you design the report called My Revenue by Region using the Region attribute and the Revenue metric. The report on which it is based can be found in the MicroStrategy Tutorial project in the following location: Shared Reports\Subject Areas\Sales and Profitability Analysis. The report is shown in the image below:

Designing a report
The following procedure assumes you are using report objects from the MicroStrategy Tutorial project and are making use of the sample Tutorial data. For details on the Tutorial project, see About sample data and the MicroStrategy Tutorial project.
This procedure also assumes you are familiar with the Report Editor in MicroStrategy Web; see MicroStrategy Web Report Editor interface in Reporting Interfaces in MicroStrategy for an introduction to the Report Editor functionality.
To design the Revenue by Region report
- In MicroStrategy Web, log in to the MicroStrategy Tutorial project, click the MicroStrategy icon and select New Report.
- Select Blank Report.
- In the Object Browser on the left, click Schema Objects to open the Schema Objects folder. Open the Attributes folder and then the Geography folder.
- Double-click the Region attribute to add it to the Template pane.
- In the Object Browser, browse to the Public Objects folder. (To do this, navigate back to MicroStrategy Tutorial, then select Public Objects.) In the Public Objects folder, select Metrics.
- In the Metrics folder, open the Sales Metrics folder. Double-click the Revenue metric to add it to the Template pane.
- Click Save.
- Click Run newly saved report to execute the report and display the results, showing sample data from the sample data warehouse. When a report like this is built using your organization's objects, this view provides actual revenue numbers an analyst can use for detailed reporting purposes.
- From the Home menu, select Graph. This lets analysts compare data on a higher level to see how various regions are doing in terms of revenue.
