MicroStrategy ONE
Placement of Report Objects and Choice of Graph Styles
Depending on the graph style you select, if you place attributes and metrics on your grid in certain ways, the graph cannot be generated. When this occurs, the system notifies you that the report contains insufficient data to be displayed in the selected graph style.
Check that you have chosen the right graph style for the number of attributes and metrics you have. For information about the minimum requirements of each graph style, see the table in Minimum Object Requirements for Each Graph Style. Once you have determined that the graph style is an appropriate choice, experiment with different ways to position the attributes and metrics on the grid until the graph is generated in the selected style.
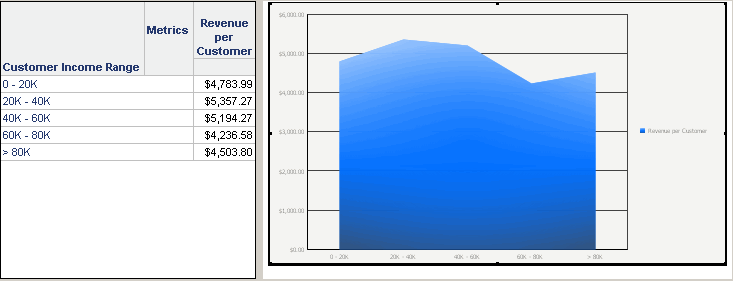
Consider the following example. The grid report for the graph below contains the following:
- An attribute (Customer Income Range) in the grid rows
- A metric (Revenue per Customer) in the grid columns
In the image below, the grid report is displayed as a graph using the Area graph style.

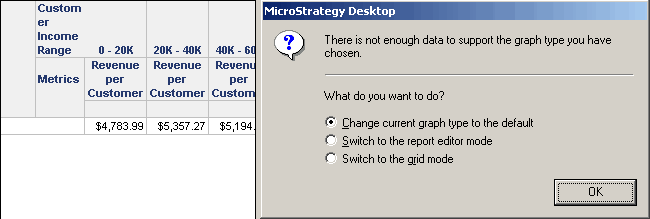
Next, move the attribute to the columns. When you view the resulting graph, you encounter an error, as shown in the image below.

This occurs because the placement of the attributes on the grid columns does not accommodate the display format of the Area graph style. The error also occurs if you move the attribute to the columns and the metric to the rows.
As you design your graph, remember that the location of the report objects on your grid determines whether your report data can be displayed using a style of graph.
