Strategy ONE
Using rank and percent-to-total metric analysis
You can create derived metrics that display the percent in relation to a selected total of each item affected by the metric or display a ranking number to the metric values for a given attribute.
These can be quickly created using shortcut metrics. Shortcut metrics are a set of quick metrics you can create on the fly for a given report, based on the metrics already in the report. Shortcut metrics include:
- Percent-to-total shortcut metrics, which display the percent in relation to a selected total of each item affected by the metric. To create this type of shortcut metric, see Creating a percent-to-total shortcut metric.
- Rank shortcut metrics, which apply a ranking number to the metric values for a given attribute. To create this type of shortcut metric, see Creating a rank shortcut metric.
- Transformation shortcut metrics, which apply offset values, such as "four months ago," to an attribute that you select.
All the shortcut metrics are derived metrics, except for transformation shortcut metrics. Transformation shortcut metrics must be calculated in SQL and are therefore only available to users that have the Modify the List of Report Objects (Use Object Browser) privilege. Because they must be calculated, the report re-executes to display the new metric. Transformation metrics are not covered in this guide, see the Advanced Reporting Help. Reports are not re-executed when other shortcut metrics are created.
Creating a percent-to-total shortcut metric
A percent-to-total shortcut metric displays the percent in relation to a selected total of each item affected by the metric. Use a percent-to-total shortcut metric to show cell-level values as percents of an accumulated row or column total. The metric can also show a total by page, show a total for each value of the attribute, or show the grand total.
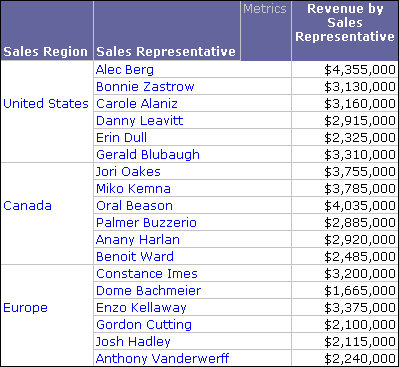
For example, a report contains Sales Region, Sales Representative, and the Revenue by Sales Representative metric as shown below.

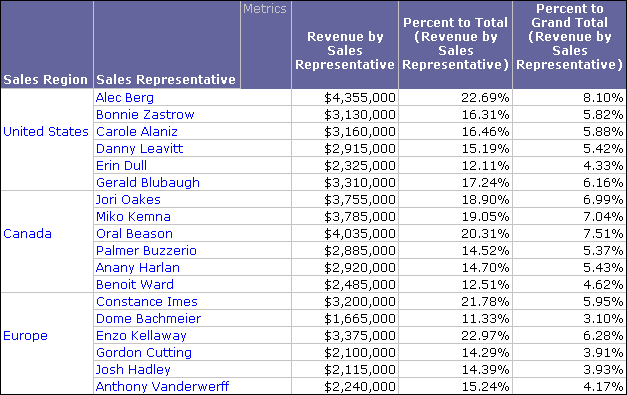
Along with revenue totals for each sales representative, you can also highlight a sales representative's percent contribution to revenue for their sales region, as well as company-wide. You insert two percent-to-total shortcut metrics to display this information, as shown in the report below:

This report provides analysis into sales representatives' performances at both the regional and company-wide level.
The following rules apply to percent-to-total shortcut metrics:
- Row and column percent-to-totals refer to the extreme-left and topmost positions, respectively.
- Page percent-to-totals affect all attributes on a page.
- Percent to All -> A1, where A1 is an attribute, indicates that the calculation is performed across all elements of that attribute. An example is percent to all stores.
- If a report does not contain attributes at a given percent-to-total level, the level is unavailable for that report.
- In some cases, two or more percent-to-total calculations at different logical levels yield the same result. For example, Percent-to-Page Total data can be the same as Percent-to-Grand Total data in a single-page report.
- The level of a percent-to-total shortcut metric remains constant once the metric has been calculated; subsequent manipulation of objects on the report does not affect it.
The steps below show you how to create a percent-to-total shortcut metric.
Prerequisites
- You need the Create Derived Metrics (Developer) and/or the Web Create Derived Metrics and Derived Attributes (Web) privileges. These privileges are part of OLAP Services.
To create a percent-to-total shortcut metric
-
Open a report in MicroStrategy Developer or Web.
If you are running Strategy Developer on Windows for the first time, run it as an administrator.
Right‑click the program icon and select Run as Administrator.
This is necessary in order to properly set the Windows registry keys. For more information, see KB43491.
- Right-click the metric to see data displayed as percents of a total, point to Insert (Developer) or Insert Metric (Web), point to Percent to Total, and then select the portions of the report for which percent-to-total data is to be calculated. Options are:
- Over Rows: Displays values in each row of the report as percents of an attribute row total. Row percent-to-totals refer to the attribute in the extreme-left position. This option is best suited for reports that display attributes in the rows and metrics in the columns.
- Over Columns: Displays values in each column as percents of an attribute column total. Column percent-to-totals refer to the attribute in the topmost position. This option is best suited for reports that display attributes in the columns and metrics in the rows.
- Page Total: Displays all values on a page as percents of that page's total. This option is available only on reports that include an object in the page-by area.
- Grand Total: Displays all values in a report as percents of the grand total for that report.
- Total for each: Displays all values pertaining to a given report component (an attribute, for example) as percents of the total accumulated for that component.
The report is updated showing your new shortcut metric that displays the percent-to-totals for the components selected. To edit a shortcut metric, see Editing derived metrics. To format the values or headers of a derived metric, see Formatting derived metrics.
Creating a rank shortcut metric
A rank shortcut metric applies a ranking number to the metric values for a given attribute. Use the rank function to show the relative position of a given cell content in relation to other values for a report component. The rank shortcut metric provides break-by options for each attribute on the report.
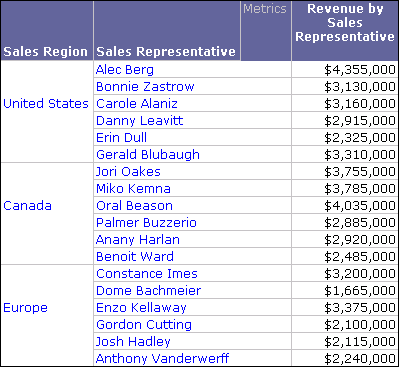
For example, a report contains Sales Region, Sales Representative, and the Revenue by Sales Representative metric as shown below.

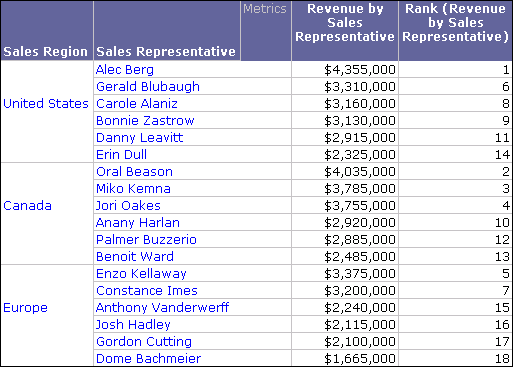
Along with revenue totals for each sales representative, you can also highlight sales representatives' relative performances company-wide. You insert a rank shortcut metric to display this information, as shown in the report below:

This report provides analysis into sales representatives' relative performances company-wide. If you use Sales Region as a break-by, employees would be ranked within their sales regions.
By default, a rank shortcut metric ranks values from low to high in ascending order. Therefore, the lowest value has a rank of 1 and the highest value has a rank equal to the total number of items being ranked within a given break-by grouping. You can change the metric to rank in descending order by editing the metric.
Refer to the procedure below for steps to create a rank shortcut metric.
Prerequisites
- You need the Create Derived Metrics (Developer) and/or the Web Create Derived Metrics and Derived Attributes (Web) privileges. These privileges are part of OLAP Services.
To create a rank shortcut metric
- Open a report in MicroStrategy Developer or Web.
- Right-click the metric to rank, point to Insert (Developer) or Insert Metric (Web), point to Rank, and then select the break by value from the list. You have the following options:
- Break by None: No break by is used and the rank is calculated accounting for each separate item on the report.
- Break by Object: A break by on Object is used to calculate the rank. For example, a report contains Region, Employee, and the Revenue metric. You select to Break by Region. Each employee is ranked within their region; that is, each region has a separate ranking.
- If you are creating a rank shortcut metric in MicroStrategy Web, you must choose from the following sort orders:
- Ascending: Values are ranked from least to greatest in ascending order. Therefore, the smallest value has a rank of 1 and the largest value has a rank equal to the total number of items being ranked within a given break-by grouping.
- Descending: Values are ranked from greatest to least in descending order. Therefore, the largest value has a rank of 1 and the smallest value has a rank equal to the total number of items being ranked within a given break-by grouping.
In Developer, by default, a rank shortcut metric ranks values from low to high in ascending order. You can change the metric to rank in descending order by editing the metric, as described in To change the ranking order of a rank shortcut metric.
The report is updated showing your new shortcut metric that displays the ranking for the components selected. To edit a shortcut metric, see Editing derived metrics. To format the values or headers of a derived metric, see Formatting derived metrics.
To change the ranking order of a rank shortcut metric
When creating rank shortcut metrics in Developer, a rank shortcut metric ranks values from low to high in ascending order. You can change the metric to rank in descending order by editing the metric, as described in the steps below.
Prerequisites
- You need the Create Derived Metrics (Developer) and/or the Web Create Derived Metrics and Derived Attributes (Web) privileges. These privileges are part of OLAP Services.
To change the ranking order of a rank shortcut metric
- In MicroStrategy Developer, open a report that contains a rank shortcut metric.
- Right-click the rank shortcut metric and select Edit. The Input Metric Formula dialog box opens and displays the metric formula.
- Modify the ranking order by modifying the
ASC=ranking_order parameter, as described below: ASC=True: (Default) Values are ranked from least to greatest in ascending order. Therefore, the smallest value has a rank of 1 and the largest value has a rank equal to the total number of items being ranked within a given break-by grouping.ASC=False: Values are ranked from greatest to least in descending order. Therefore, the largest value has a rank of 1 and the smallest value has a rank equal to the total number of items being ranked within a given break-by grouping.- Click Validate to confirm that the metric definition is valid for use by the MicroStrategy engine.
- Click OK to return to the Report Editor or Report Viewer. Any rank ordering changes are displayed in the report.
