Strategy ONE
View filter effects on derived metrics
For most derived metrics, view filters have the same effects as they do on standard metrics created with the Metric Editor. When data is restricted from view, the derived metric values along with any related data is hidden from the view of the report. For example, if a view filter restricts data to the year 2007, then any derived metrics and standard metrics included on the report only display data for the year 2007.
However, derived metrics created with relative functions (OLAP functions and Rank and Ntile functions) are affected by the evaluation of view filters in a unique way.
A derived metric uses the data available on a report to calculate its values. Since view filter qualifications restrict the data displayed on the report, this can also restrict the data available for derived metrics, depending on the evaluation order of the two objects. This restriction of data, combined with derived metrics with relative functions that depend on other values on the report, can effect the display of report results.
The view filter effects on derived metrics with relative functions depends on how view filters are used in such reports, as described in the sections listed below:
- Using view filters that affect derived metrics with relative functions: Derived metrics with relative functions such as RunningSum or Rank return values that are relative to other values on a report. When data is restricted by view filter qualifications on other objects of a report, you can allow the values of derived metrics with relative functions to calculate their relative values based on the new view of report data.
- Using derived metrics with relative functions in view filters: Derived metrics with relative functions such as RunningSum or Rank return values that are relative to the data on a report. When derived metrics with relative functions are used to define view filters, you can allow the relative values to reflect the new view of data or retain the relative values for all report data.
Using view filters that affect derived metrics with relative functions
Derived metrics with relative functions such as RunningSum or Rank return values that are relative to other values on a report. When data is restricted by view filter qualifications on other objects of a report, you can allow the values of derived metrics with relative functions to calculate their relative values based on the new view of report data.
For example, consider a report created in the MicroStrategy Tutorial project with Year, Category, Profit, Profit Margin, and a rank shortcut derived metric named Rank (Profit Margin) as shown below.
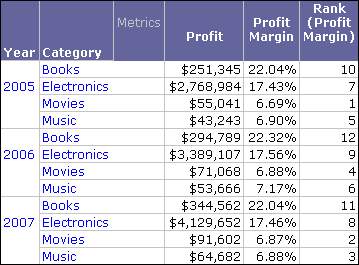
Notice that the 12 rows are ranked in ascending order from 1 to 12 by their profit margin values. You then create a view filter qualification to display data only when profit is less than $1,000,000. The view filter and resulting report are shown below.
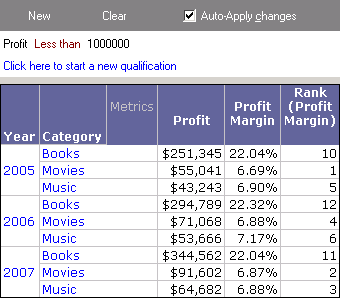
Notice that while some data no longer appears on the report, the values of the Rank (Profit Margin) derived metric remain the same. This allows you to view the rank of profit margins as applied over all the data for the report, including the data that has been filtered from view.
Since the Rank (Profit Margin) metric is a derived metric, you can modify the report so that the metric's values are relative to the new view of data supplied by the view filter, as shown in the report below.
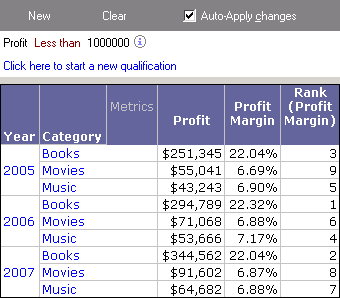
You can apply this type of analysis in one of two ways:
- Evaluate the view filter qualification at the report level. This causes the view filter to be evaluated before any derived metrics. The derived metrics then calculate their data using the view of data created by the view filter. For information on evaluating view filter qualifications at the report level, see Evaluating qualifications at the report or grid level.
- Evaluate the view filter qualification at the grid level and change the evaluation order of derived metrics to be calculated after the view filter. For information on changing the evaluation order of individual report objects such as view filter qualifications and derived metrics, see the Advanced Reporting Help.
Using derived metrics with relative functions in view filters
Derived metrics with relative functions such as RunningSum or Rank return values that are relative to the data on a report. When data is restricted by view filter qualifications on derived metrics with relative functions, you can allow the relative values to reflect the new view of data, or retain the relative values for all report data.
When derived metrics with relative functions are used to define view filters, you can allow the relative values to reflect the new view of data or retain the relative values for all report data.
For example, consider a report created in the MicroStrategy Tutorial project with Year, Category, Profit, Profit Margin, and a percent-to-total shortcut derived metric named Percent to Total Over Rows (Profit Margin), as shown below.
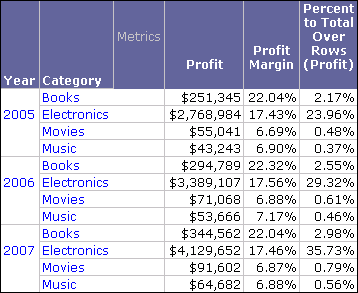
Notice that the percent-to-total values display the distribution of profits over all 12 rows of data. You then create a view filter qualification based on the percent-to-total derived metric to display data only when the percent-to-total profit is less than two percent (.02). The view filter and resulting report are shown below.
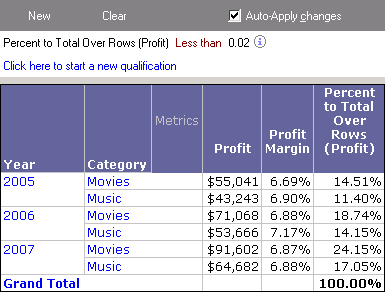
While it appears that data is being shown for percent-to-totals greater than two percent, this is because the Percent to Total Over Rows (Profit) derived metric values have dynamically changed to reflect the new view of data displayed on the report. A grand total is displayed to show that the derived metric values add up to 100%, even though these rows of data combined account for less than four percent of the profits of the original report. This analysis is applied because the view filter qualification is evaluated at the report level by default.
The report above provides a view of percent-to-total profit data as displayed on the report. However, view filter qualifications on derived metrics can also be evaluated at the grid level so that the derived metrics retain their values that reflect all data available for the report, as shown in the report below.
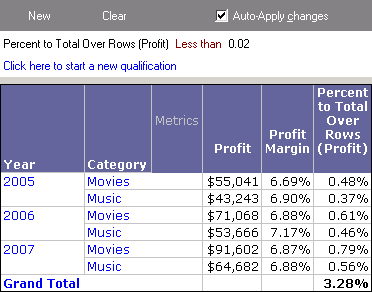
Notice that the percent-to-total profit values now appear to be less than two percent and reflect the values of the original report that included all report data. This is also reflected in the grand total of 3.28%.
As these scenarios illustrate, you have two options to evaluate view filter qualifications based on derived metrics with relative functions, summarized below:
- Evaluate the view filter qualification at the report level (default). This causes the derived metric values to dynamically reflect the new view of data on the report after the view filter qualification is applied.
- Evaluate the view filter qualification at the grid level. This causes the derived metric to retain its values that reflect all data available for the report.
For information on evaluating view filter qualifications at the report level versus the grid level, see Evaluating qualifications at the report or grid level.
