Strategy One
Introduction to Creating Report Services Documents
A Report Services document displays your organization's data in a high-quality, Pixel Perfect display. Documents allow you to showcase your business data in a user-friendly, boardroom-quality way that is suitable for presentation to management. Examples of documents include scorecards and dashboards, managed metrics documents, production and operational documents, and more.
When you create a document, you can specify the data that appears, control the layout, formatting, grouping, and subtotaling of data, and specify the position of page breaks. A broad selection of data visualizations (called widgets) and a wide variety of formatting options, including graph styles, shapes, document headers and footers, and watermarks, allows you to customize and fine-tune the appearance of your documents.
A document contains objects representing data from one or more datasets, which are sets of data that can be displayed on a document or Visual Insight dashboard. A dataset can be a report, an Intelligent Cube, or data imported directly from an external data source. Reports include Freeform SQL reports, Query Builder reports, MDX cube reports, and reports that access Intelligent Cubes. Intelligent Cubes can be based on Strategydata or imported data. The information in a dataset can include objects such as attributes, custom groups, consolidations, and metrics.
For the first-time user, see Get Started with Documents for a brief overview of documents. For a complete introduction to documents, with images, examples, and tutorials, see the Document Creation Help.
Dashboard-Style Documents
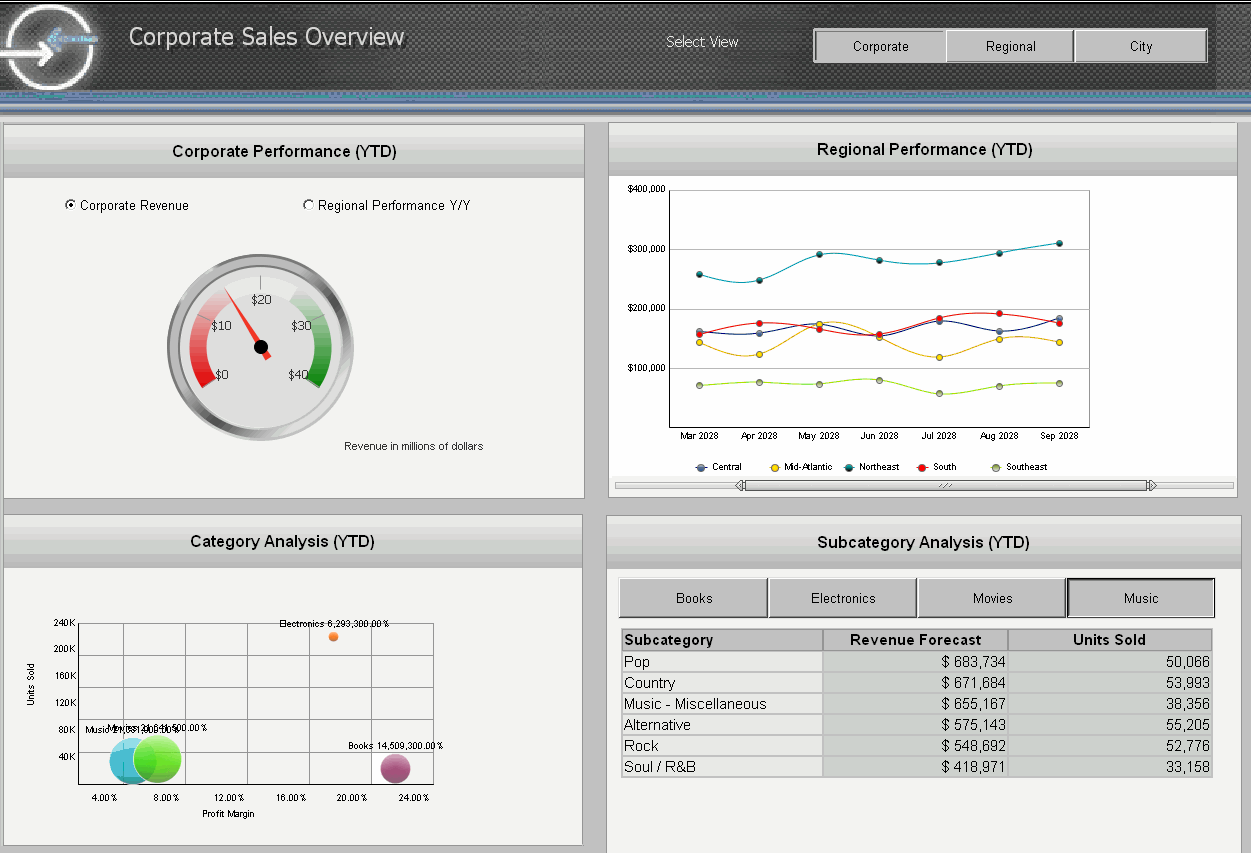
A dashboard-style document is a special type of document. A dashboard-style document is commonly only one page long, is intended to be viewed online, and usually provides interactive features that let analysts change how they view the document's data. By being only one page long, this type of document makes it easy to view the entire document at once and see all of its information. A dashboard-style document allows interactivity from users, so each user can change how they see the data, within the limits of what the controls allow them. A broad selection of widgets (described below) and a wide variety of formatting options allow you to design a customized, interactive document.
Documents provide the freedom to design pixel-by-pixel in multiple editing and previewing modes. The abundant design options deliver full control over position, formatting, and interactivity.
A dashboard-style document is a display of related sets of data on one screen, and it is commonly used to assess company or personal performance, to take a quick status check of the company, or to monitor personal work or work group contributions to overall goals of the business. Documents summarize key business indicators, such as revenue and profit margin, by presenting them in visually intuitive, easy-to-read, interactive documents.
An example dashboard-style document is shown below:

The designer can create more flexible data presentations with dashboard-style documents than with documents, since more users can be served with a single dashboard-style document. Each user can interact with the document to display only the subset of data they are interested in (using panels and selectors) or only specific attribute elements or metrics (using a selector).
Dashboard-style documents often use widgets to give users a visual and interactive look into their data. A widget is a Flash-based display of the results of a dataset, allowing users to visualize data in different ways than traditional reports displayed as Grid/Graphs do. Widgets are sophisticated visualization techniques that can combine with rich interactivity to enable users to understand their data more effectively. For an overview of creating a widget, see Introduction to Providing Analysis and Interactivity: Widgets.
For the first-time user, see Get Started with Documents for a brief overview of documents and dashboard-style documents.
Interfaces to create documents
The Document Editor allows you to create, customize, and save documents and dashboard-style documents to be used across the Strategy platform. The Document Editor opens when you view a document in Design Mode or Editable Mode. For a complete description of the Document Editor, see Document Editor.
