MicroStrategy ONE
Analyzing data in a Graph Matrix
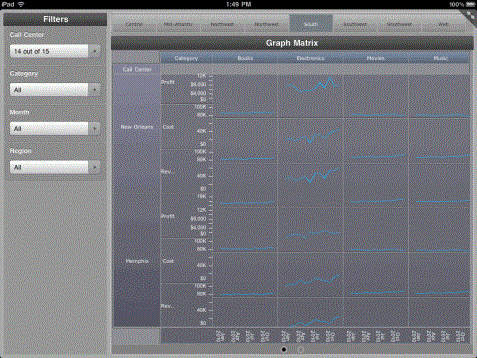
Some documents may contain a chart with multiple graphs, called a Graph Matrix visualization. The data may be displayed in different graph styles, such as line, bar, or scatter. An example of a Graph Matrix that uses line graphs is shown below.
You may be able to perform the following actions in a Graph Matrix visualization:
-
Use a pinch gesture to zoom into the graphs. To return to the original zoom level, double-tap the visualization.
-
Tap and hold points on the graphs to view additional information about them.
-
To sort the grid by a column, tap and hold the title of the column. Click Sort, then choose Ascending or Descending to sort the grid by the column.