Strategy One
Create a Comparison KPI
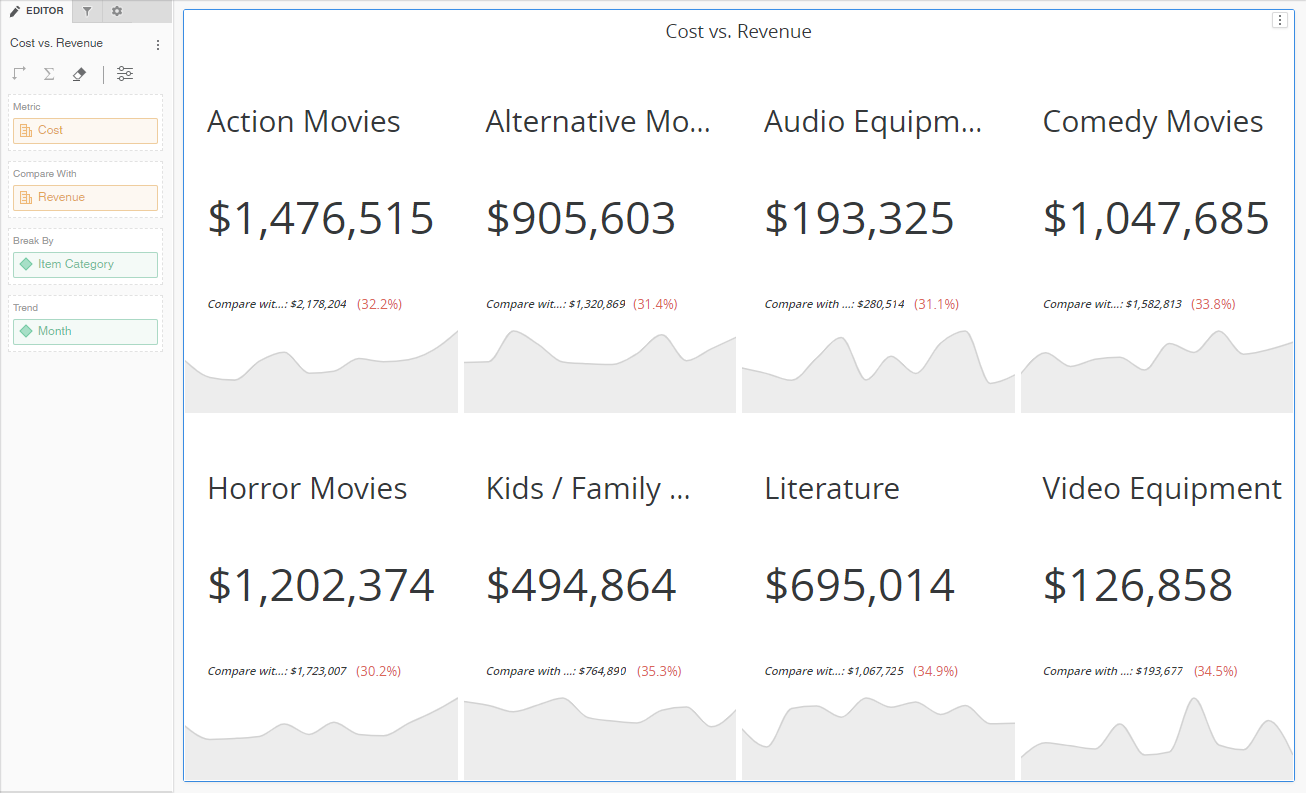
Use a Comparison KPI to indicate the progress towards an objective, like sales and goal.
                                                
                                            
Check out the video below to learn more!
- Open a dashboard.
 - 
                                                    
In the top toolbar, click .
 - Choose KPI > Comparison KPI 
. - 
                                                    
In the Datasets panel, double-click attributes and metrics to add them to the visualization. A Comparison KPI requires two metrics.
                                                     - 
                                                    
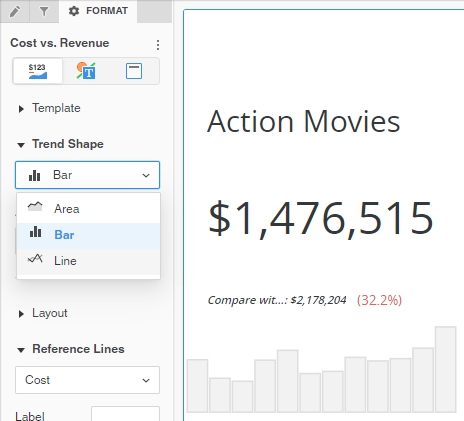
Once you have a Trend attribute, open the Format panel and choose the Trend Shape.
                                                     - 
                                                    
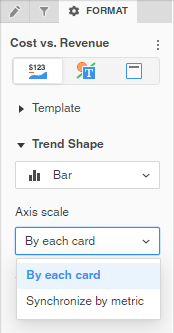
Control the axis by synchronizing by metric or each card.
                                                     - 
                                                    
Add a reference line to compare with a constant value.
                                                     - 
                                                    
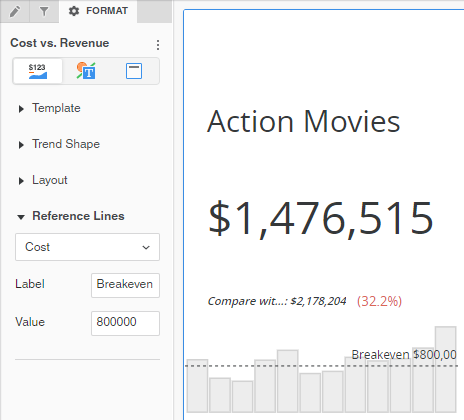
Format the reference line.
                                                     - 
                                                    
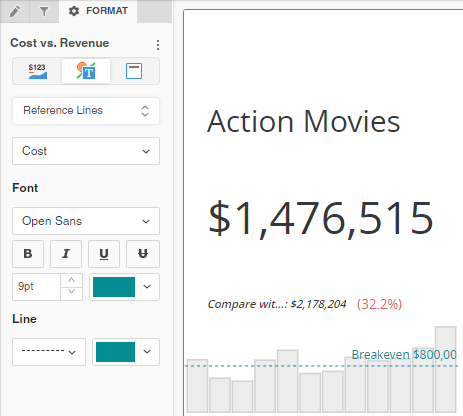
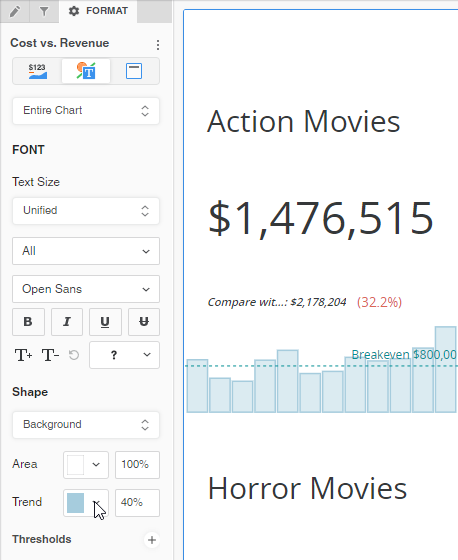
Format the trend color.
                                                     - In the Editor panel, sort the cards by value from the metric or alphabetically from the attribute.
 
