Strategy One
Create a Box Plot
- Open a dashboard.
-
In the top toolbar, click .
- Choose More > Box Plot
 .
. - In the Datasets panel, double-click attributes and metrics to add them to the visualization. A box plot requires at least one attribute and one metric.
- Open the Format panel and select Box Plot Options from the first drop-down to modify formatting options, specific to box plots.
- Click Save
 .
.
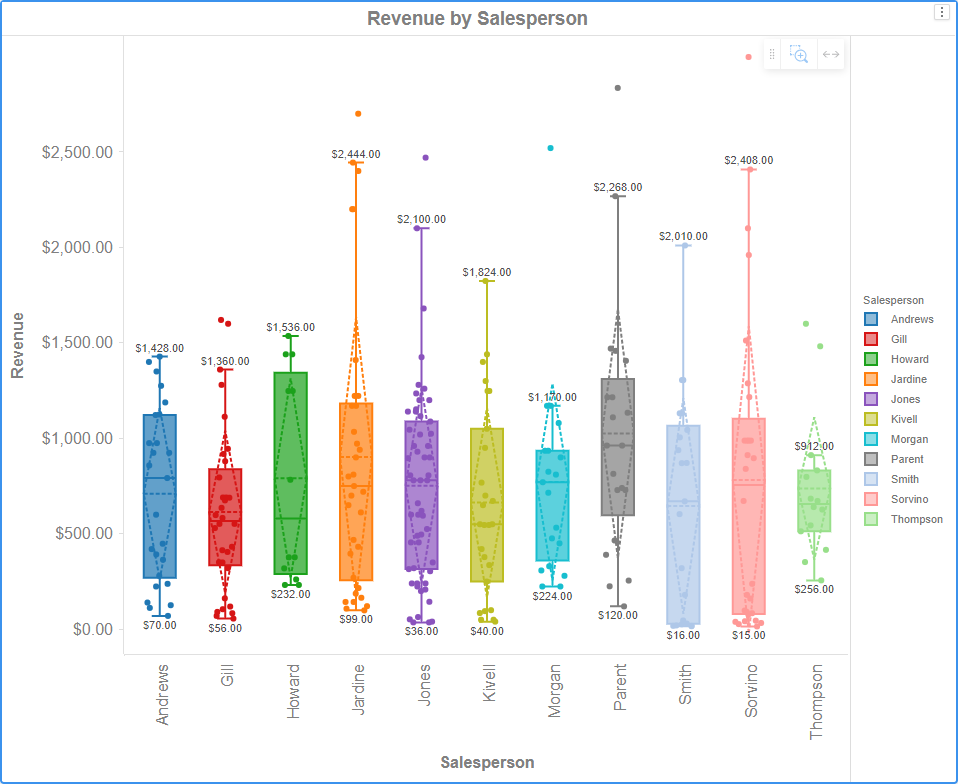
Example Box Plot