MicroStrategy ONE
ForecastV (Forecast, Vector Input)
The ForecastV function uses data recorded for certain time periods to calculate and display the expected value of data for an unknown time period. This is most commonly used to predict future metric values based on historical data. For example, based on revenue data for three years, you can predict what your Revenue will be for the coming year.
You can use ForecastV to predict values for any point in time, including dates that have known data. However, this type of function is meant for predicting future, unknown values.
This function uses a linear equation to predict future values. Therefore, it is best suited to predict values that are increasing or decreasing in a linear trend. For example, if your profits are increasing by $10,000 each year, this is a scenario that is well suited for a prediction based on a linear equation.
For a function that predicts values in a similar way for data that is increasing or decreasing exponentially, see GrowthV (Growth, Vector Input).
Syntax
ForecastV <FactID>(FutureTime, KnownData, KnownTimeIntervals)
Where:
FutureTime is the point in time for which to predict the data. This is commonly defined as an integer. For example, to predict values for the year 2009, you would enter the value 2009 for FutureTime (this assumes your year data is defined with IDs that match the year).
KnownData is an object representing a list of values. This list of values is the known data to use to predict a future value for. KnownData is commonly used for metrics that represent data such as revenue, profit, and so on.
KnownTimeIntervals is an object representing a list of values. This list of values provide the time intervals for which data is known. KnownTimeIntervals is commonly used for attributes that represent intervals of time such as year, quarter, month, and so on.
Since this function allows you to enter a list of time intervals, it can account for missing time intervals more accurately than the TrendV function (see TrendV (Trend, Vector Input)). For an example, see the examples described below.
FactID is a parameter that forces a calculation to take place on a fact table that contains the selected fact.
Example
The ForecastV function is useful to display predicted future values of a metric as a subtotal of the metric on a report.
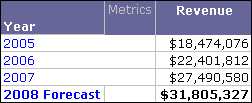
For example, in the MicroStrategy Tutorial project a new subtotal named 2008 Forecast can be created with the following definition:
ForecastV(2008, x, Year)
Since this is in a subtotal, the x is a placeholder for a metric. When a subtotal is applied to a metric on a report, the placeholder inputs that metric’s values.
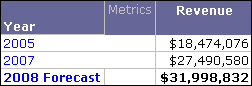
Also, 2008 is used for the period in time to predict metric data for because the Year attribute uses ID values that match the year.
After making the new custom subtotal available for the Revenue metric (see the Advanced Reporting Guide for steps to make custom subtotals available for metrics) a report with the attribute Year and the metric Revenue is created. When the 2008 Forecast is displayed on the report, it displays the predicted value for 2008 Revenue, as shown below:
Since the ForecastV function allows you to enter a list of time intervals, it can account for time intervals that you have no data for. For example, consider the same report in a scenario in which there was no data available for the year 2006. The ForecastV function can still use the two available years to predict the revenue for 2008.