MicroStrategy ONE
Outlining data
You can create an indented grouping of related data on a grid report by organizing the data into a standard outline style. Using an outline style, you can collapse and expand sections of related data, as shown in the images below.
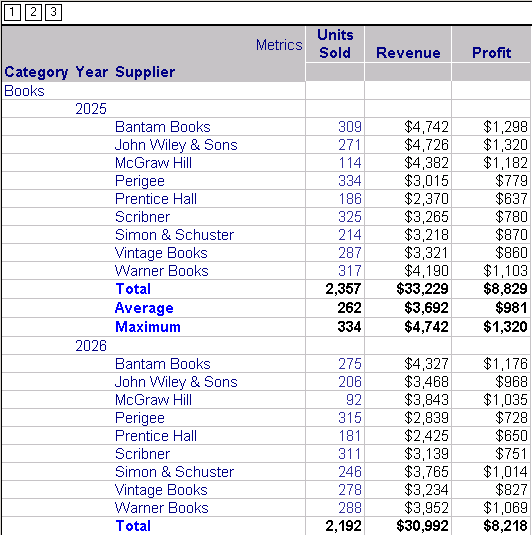
The image below shows just a small portion of an outlined report expanded completely. The outline style is controlled with the numbered buttons that appear in the top left corner of the report. For this image, button 3 was clicked, which expands the outline down to its third level. In this case, the third level is Supplier. Note that most of the report data cannot be viewed without scrolling, but each item of data and its related metric numbers can be seen clearly:
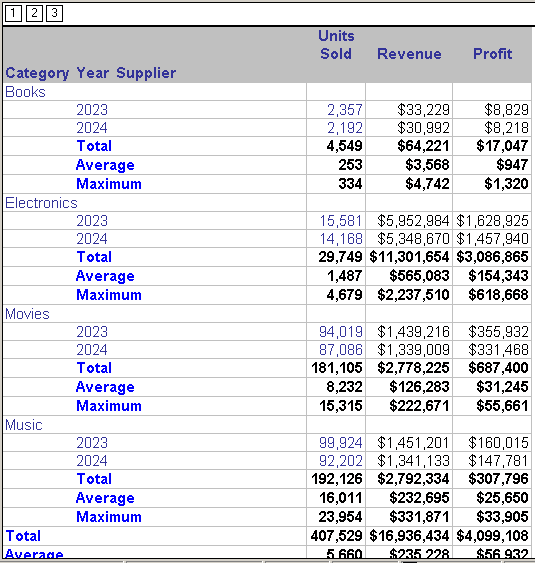
The next image shows the same report as in the image above, but with the lowest level of data collapsed and only the higher levels of data expanded (button 2 in the top left corner was clicked). Note that you can almost see the entire report in a single screen. The detailed data is hidden, but higher level numbers can be analyzed and compared more easily. It is also easier to compare totals and averages for each category.
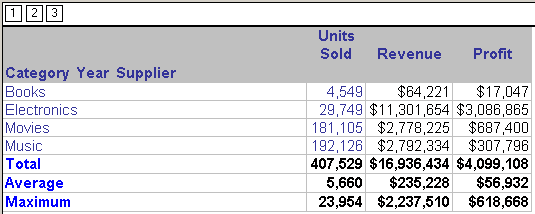
The next image shows the same report as in the images above, but with all data levels collapsed fully (button 1 in the top left corner was clicked). Note that this outline level provides the highest summary of data:
Outlining is particularly useful when information displayed would otherwise involve repetitive entries. For example, you want to display sales for three years, 2004, 2005, and 2006. You also want data listed by month within each of the years. Rather than having all data visible for every month of every year, you can use an outline to expand and view just that data you want to see immediately, and keep other data collapsed, to be expanded later for quick comparisons.
Multiple-page reports work in the same way. For example, if you are on page 4 of a multiple-page report and you want to collapse the data to the second level, then you will only be collapsing data that is displayed on the fourth page of the report.
Enabling an outline
Use the appropriate procedure below, depending on whether you are working in MicroStrategy Developer or MicroStrategy Web.
Outline mode is only available when the report has more than one object in the rows. For example, if your grid report has business attributes on the rows of the report, there must be more than one attribute if you want to use outline mode.
To enable an outline in Developer
- Open a grid report.
- From the Grid menu, select Display Outline Results. You can expand and collapse the outline levels by clicking the numbered buttons at the top of the report. There is one button for each outline level in the report.
Each outline level usually represents a business attribute on the report. For a detailed explanation of rows and columns and what business data they represent, see Components of a report.
To enable an outline in MicroStrategy Web
- Open a grid report.
- From the Tools menu, select Report Options.
- Select the Outline check box, and click OK.
- You can expand and collapse individual levels by clicking the + or - box within each row on the report. Click the numbers above the report to expand or collapse everything to a certain outline level.
Each outline level usually represents a business attribute on the report. For a detailed explanation of rows and columns and what business data they represent, see MicroStrategy Basic Reporting.
Initial display of an outline
Depending on whether you are using MicroStrategy Developer or MicroStrategy Web, you may be able to change how outlined reports appear when they are opened.
- MicroStrategy Web: By default, reports with an outline applied are displayed with all outline levels collapsed. This default cannot be changed.
- MicroStrategy Developer: By default, reports with an outline applied are initially displayed with all levels expanded. However, you can specify how you want the report to display when it is opened. You can have an outlined report open with a specific level already expanded, or with all outline levels collapsed.
To determine how an outline displays initially
- In Developer, open a grid report.
- If the report does not already have Outline mode enabled, from the Grid menu choose Display Outline Results. The report is displayed in Outline mode.
- From the Grid menu, select Options.
-
Click the General tab, and select one of the following:
- Open with all outline levels expanded: The report will open with all outline levels expanded. This is the default setting.
- Open with all outline levels collapsed: The report will open with all outline levels collapsed.
- Open outline expanded up to this level: The report will open expanded up to the level you select from the drop-down list. The list becomes available once you choose this option.
- Click OK.
- Click Save.