MicroStrategy ONE
Formatting groups of report rows or columns: Banding
You can color groups of report rows or columns so that they form bands of data that are easy to locate and analyze. Banding can also make it easier to make sense of a very large report, because the large amounts of data are broken up into visual groups. If you need to keep track of values that mean different things in different columns (for example, dollars in one column and inventory quantities in another column), banding can help an analyst avoid making the mistake of reading the wrong number.
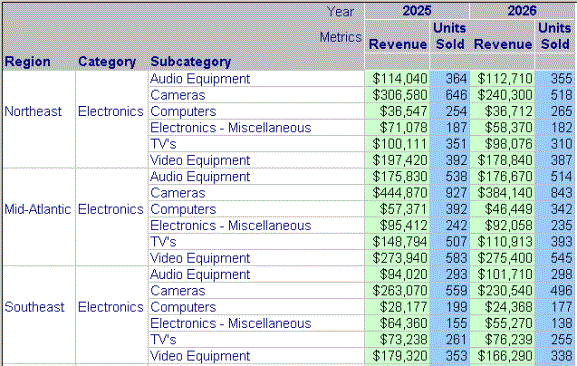
Banding is a method of organizing or grouping data values in a grid report according to certain criteria. You can band rows or columns in several ways. You can band based on the number of rows or columns (for example, alternating color every 5 rows). You can also band based on the row and column headers (for example, sorting the Units Sold column in order, then applying alternating colors to sets of values). As shown in the image below, banding based on column headers helps keep financial numbers from getting confused with unit counts.
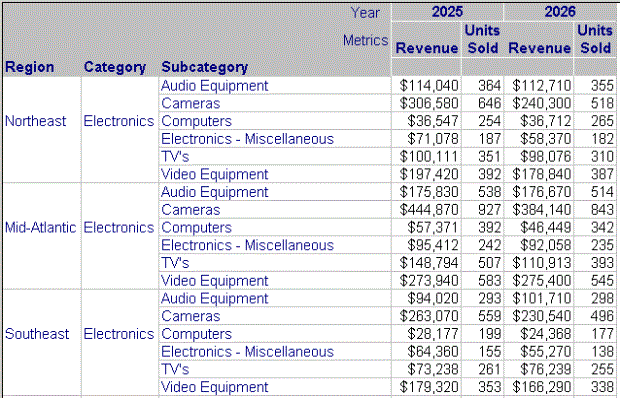
For example, for the report shown below, you want to band the columns according to Revenue and Units Sold, such that all Revenue columns appear with one color and all Units Sold columns appear with another color.
To do this, you choose to band by columns, and you select the banding colors. After applying the banding, the report appears as shown below.
The autostyle of a report provides the report's default banding options, but you can define custom banding or even turn off banding for a report, regardless of its autostyle. (For information on autostyles, see Preset formatting: Autostyles.)
You can perform more complex banding of report data, based on custom grouping of attribute elements (for example, Northeast, Mid-Atlantic, and Southeast on the report above) and other banding conditions. For details, see the chapters on Custom Groups and Consolidations as well as Reports in the Advanced Reporting Help.
You cannot create banding formatting in MicroStrategy Web. However, you can enable or disable the display of banding on a report in Web. The procedure is below.
To create custom banding in Developer
- Open a grid report.
- From the Grid menu, select Options.
- On the General tab, select Custom banding.
- Click Settings.
- Set the banding options as desired. For details on each option in the dialog box, click Help. In the example above, to band by columns, you select the banding criteria By column header and select the banding color.
- Click OK.
To turn off banding in Developer
- Open the banded report.
- From the Grid menu, select Options.
- Select No Banding and click OK.