MicroStrategy ONE
Filtering data
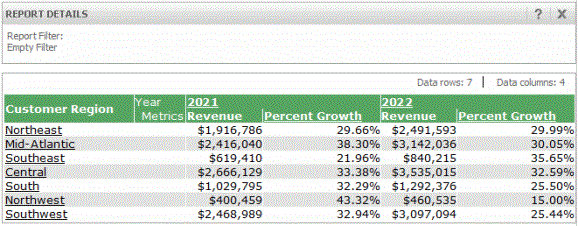
A report filter sifts the data in your data source to bring back the information that answers exactly what you require. The following image shows a report that has not had a filter added to it. (This is the Yearly Revenue Growth by Customer Region report, located in the sample Tutorial project.) You can see that the filter is empty by looking at the information in the Report details pane above the report, as shown in the image below:y

(To display report details for any report, click the Report Details icon ![]() .)
.)
Now a filter is applied to the report, for the Eastern regions of the United States (Northeast, Mid-Atlantic, and Southeast). The following image shows the Yearly Revenue Growth by Customer Region report "filtered on" specific regions. You can see the filter's definition in the Report details pane above the report. The filter definition is {Customer Region} = Northeast, Mid-Atlantic, Southeast.

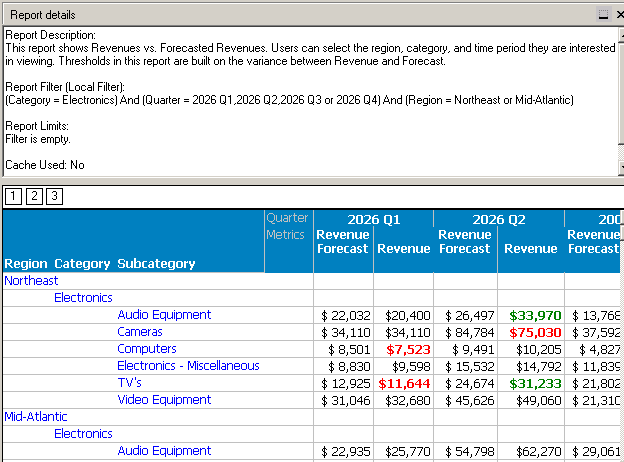
A more complex filter is used in the next report. The report shows revenue and revenue forecasts. The filter selects only that data related to a company's electronics products, only for the company's northeastern and Mid-Atlantic US stores, and only for the current year. The filter's definition is:
[Category = Electronics] And [Quarter = 2006 Q1,2006 Q2,2006 Q3 or 2006 Q4] And [Region = Northeast or Mid-Atlantic]
The report and its filter are shown in the image below.

Filters are usually created and added to reports by a report designer. For any report, you can easily see not only whether a report has a filter applied to it, but also what that filter's definition is. You can view this information in the Report Details pane, as shown in the images above. This information helps you understand exactly what data in your data source was included in the report's results, as well as what was excluded. For steps to view a filter's definition in a report, see Viewing a filter's definition.
OLAP Services view filters and regular filters
MicroStrategy OLAP Services lets MicroStrategy Developer, Web, and Office users slice and dice data in reports without having to re-execute SQL against the data source. Different from a report filter that restricts how much data is retrieved from the data source, a view filter dynamically limits the data being displayed on a report without re-executing the report against the warehouse.
The advantage of using both standard report filters and view filters on a report is that the report can use the standard report filter to bring back more data than can usefully be displayed at any one time. The analyst can then use a view filter to change the data displayed, as long as it falls within the data already retrieved from the database. The analyst generates a view report, which is the result of a view filter. A view filter does not trigger re-execution against the data source. This capability translates into improved response time and decreased database load.
For details on MicroStrategy OLAP Services, see OLAP Services.
