MicroStrategy ONE
Determining how metric data is combined: Metric join types
When you execute a report, data is often retrieved that has come from more than one table in your data source. The final results on any report are greatly dependent on the organization and structure of your data source tables and how data is stored within them.
When data is pulled from two or more tables of metric data in your data source, a metric join determines the way that data is combined into a single set of data. The order in which the data is joined from the different tables can affect the outcome of the data calculation, just as the order of operations in any arithmetic expression can affect the result.
Knowing how data is calculated for metrics on a given report is an important part of the data analysis process. Several decisions go into determining rules for how data is calculated when that data is pulled from different tables in your data source. Calculation rules for metrics are defined at several organizational levels:
- How data is calculated by default is usually decided first by your company's project designer, who implements several settings on a project-wide basis that affect how SQL handles your organization's data during calculation. These decisions are often driven by the type of database your organization owns; most databases process SQL differently. These settings are generally made within the VLDB properties for your project's database instance within MicroStrategy. For details on metric-specific VLDB properties, see the Advanced Metrics chapter in the Advanced Reporting Help.
- Next, the person in your company who designs a metric can override the project-level default settings described above when she creates the metric. When a metric designer applies settings to a specific metric, these settings are effective for that metric no matter which reports the metric is used in. For details on metric calculation settings at the metric level, as well as joins for a compound metric (a metric that is made up of other metrics), see the Advanced Metrics chapter of the Advanced Reporting Help.
- Finally, report analysts can change how a metric is calculated for a single report with which the analyst is concerned. You can view the existing settings for a metric, as well as change various settings, within the Report Data Options dialog box. (For steps to do this, see Viewing and changing metric join types.) Any changes made to metric joins in the report will override any join settings that were made by your company's metric designer or by your company's project designer, described above. However, changes made to the join type using the Report Data Options dialog box affect this metric on this report only. When the metric is used on another report, it uses its default metric join type. These report-level metric join options are discussed in detail below.
Metric joins
An understanding of your organization's data source storage structure is helpful to understand the details of metric joins.
A metric is often calculated based on data that comes from more than one table in your data source. Data coming from multiple tables must be joined together in some way during data calculation.
A metric join setting determines how data is combined by applying a specific type of join, inner or outer. The MicroStrategy SQL Engine applies the designated join type to the data pulled from your data source's tables. The join type places conditions on the data to be displayed in the report.
Inner and outer joins are discussed with examples below.
- Inner join: An inner join includes in the calculation only the data common to all the tables from which data is being gathered in your data source.
- Outer join: An outer join includes in the calculation all of the data in all of the tables from which data is being gathered in your data source.
Examples of inner and outer joins
Inner joins are generated by default for all metrics in a report. The resulting report contains only those rows that have data returned for all the metrics.
For example, review the data in the following table. The Sales Information and Budget Information columns show whether data exists in the data source for that type of data in that region.
| Region | Sales Information? | Budget Information? |
| North | Yes | No |
| South | Yes | Yes |
| East | Yes | Yes |
| West | No | Yes |
A report is created containing Sales and Budget metrics, and the Region attribute. The default inner join is not changed, because you want to view metric values that are common to both metrics and that are therefore not empty for either metric. Since the North region does not have any budget data, as shown in the table above, no data is displayed for the North region on the report. Similarly, the table above shows that sales data has not been tracked for the West, so all data for the West region is also omitted from the report. The resulting report, with an inner join between metrics, displays only those regions that have both sales and budget information, or data that is common to all components of the join. The result looks like the following report:

However, assume you need to change your analysis and you want to display all of the data from the tables in your data source, whether or not data exists for all the metrics at all levels in the report. (For a definition and examples of levels, see How data is aggregated on a report: metric level.) You apply an outer join to both metrics because you know there is some incomplete or empty data for some regions in your data source. The outer join results in the following report, in which the North and West regions appear even though they have no data for one of the metrics.

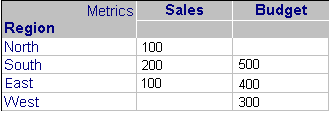
Finally, you can specify different joins for each of the metrics on a report. You want to see all sales data even if budget data has no values for some regions in your data source, so you apply an outer join to the Sales metric and an inner join to the Budget metric. All regions (all report rows) with information on sales are displayed. The following report is created:

West is not displayed because it does not contain sales information. It is irrelevant whether data exists for the Budget metric or not.
When to use an inner or outer metric join
Inner joins
An inner join is generally more commonly used for metric data than outer joins. (The exception is with rank metrics; see Outer joins below for details.) Inner joins are effective in many situations, including the following:
- Inner joins provide effective results when you know the metrics on your report are closely related to each other, such as the Revenue metric and the Profit metric.
- Inner joins are most effective if your data source contains relatively complete metric data, without empty values.
- Inner joins require less processing time than outer joins, so they are useful to lessen the processing load on your MicroStrategy Intelligence Server machine.
Outer joins
Outer joins are effective if your data source contains empty values for some metric data in some tables. Outer joins are also necessary for metrics that show rank. Outer joins allow you to see all data that is available for a metric.
For example, your revenue data may be completely up to date, but several profit values have not been reported and entered in the data source for certain days during the past week. When the Revenue and Profit metrics are both included on the same report, you can apply an outer join to the Revenue metric so that you can see all values for Revenue for each day of the past week, even if the Profit value for a given day is currently empty.
When a metric calculates rank, it is important to use an outer join on the rank metric. If the default inner join is used on a rank metric, some of the ranks (and therefore, the ranked attribute elements) may not appear on the report because an inner join does not include elements with null values in the result set. But an element with a null value may have a rank. With an outer join, all rows are displayed on the report even if there is no result displayed for some of the elements for some of the metrics on the report. The goal for a rank metric is to display all rankings, so all elements must appear whether they have values or not.
Viewing and changing metric join types
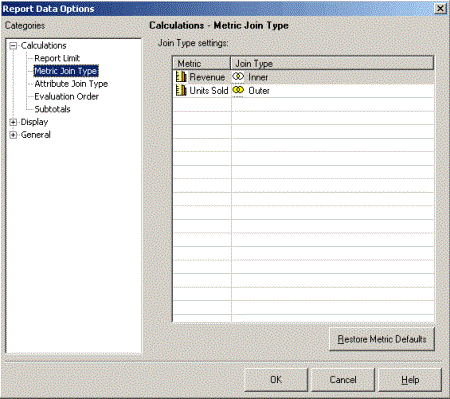
The image below shows the metric join type setting in the Report Data Options dialog box.

To view and change metric join types
- In Developer, open a grid report.
- From the Data menu, select Report Data Options. Under the Calculations category, select Metric Join Type. The Metric Join Type subcategory lists all metrics on the report, along with each metric's join type, as shown in the image above.
- You can change a metric's join type by clicking the join type (Inner or Outer) for the metric you want to change.
- From the drop-down list that appears, select a different join type. Inner and outer joins are described fully above. You can select the following:
- Default: This option sets the metric to use the join type set for that individual metric when that metric was created with the Metric Editor. If no join type was determined this way for the metric, this option sets the metric to use the join type set at the project level.
- Inner: This option displays only the data common to all data source tables from which data is being gathered for this metric.
- Outer: This option displays all of the data from all data source tables from which data is being gathered for this metric.
- Click OK.
If you have a long list of metrics, you can sort them by metric name or by join type, by clicking the Metric or Join Type column headers.
