MicroStrategy ONE
Formatting Numeric Values on a Graph
While graphs rely on colors, objects, and patterns to provide insight into data, the formatting of the numeric data is also a key component to developing a graph that is easy to analyze and interpret.
Numeric data is often included on a graph as either a label for graph risers and data points, or as a label for the increments of the graph axes. To understand the effect that numeric data formatting can have on the graph, consider the graph shown below.
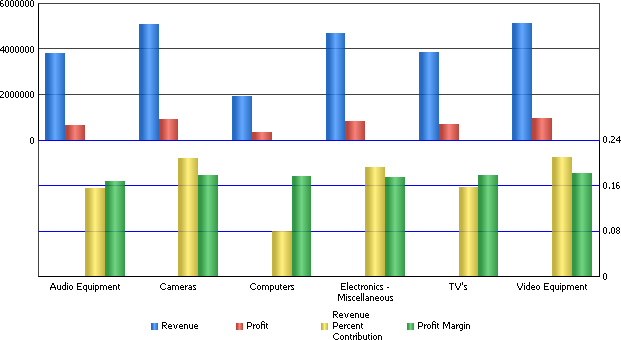
This graph displays revenue, profit, revenue percent contribution, and profit margin information for various electronic product categories. Relationships can be seen between the data for metric pairs of Revenue and Profit as well as Revenue Percent Contribution and Profit Margin. However, notice that the labels for each axis use a generic number formatting. This makes it difficult to fully understand the data that is displayed for each metric.
The same graph is displayed below, with formatting applied to the numeric values that serve as labels for the increments of the graph axes.
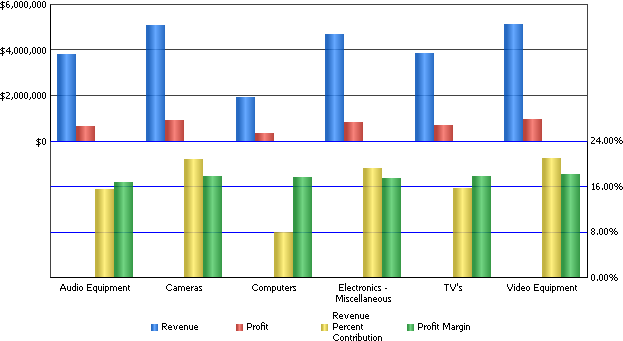
Notice that now the Revenue and Profit metrics are on an axis that is displayed with a currency format, while the Revenue Percent Contribution and Profit Margin metrics are on an axis that is displayed with a percentage format. This simple formatting change makes it easy to understand the data values at a glance.
There are two methods to applying formats to numeric values in a graph, which are described in the following sections:
Inheriting the Formatting of Numeric Values
Graphs in MicroStrategy can inherit the formatting of metric values and other numeric values. This allows the same default formatting seen on a grid report to also be displayed on a graph report. For example, the simple report shown below displays the quarterly percent growth for each region.
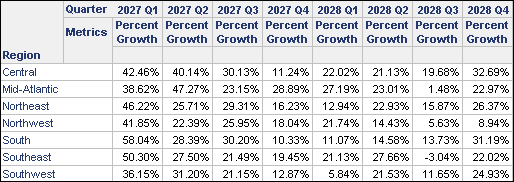
Since the Percent Growth metric uses a percentage format with two decimal places, this formatting is applied by default when viewing this report as a graph.
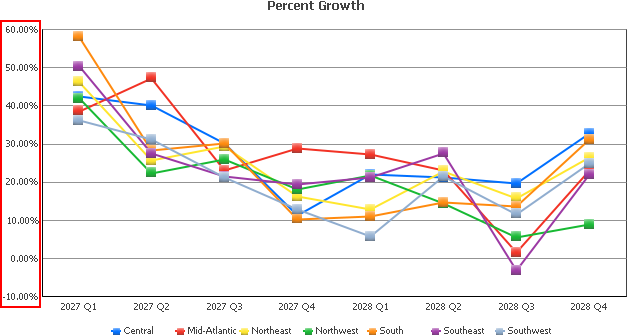
Notice that the highlighted labels on the left use the numeric formatting of the Percent Growth metric.
If a graph does not apply the formatting of a metric's values by default, you can define the graph to inherit the numeric formatting. The steps below show you how to inherit numeric formatting for objects on a graph.
A graph report has been created.
You are logged in to a project using MicroStrategy Developer.
To Inherit the Formatting of Numeric Values
- Open a report in Graph View.
- Choose Graph > Graph Options.
- Browse to the Number Formatting category for the graph object that you want to define the numeric formatting for:
- Axis labels: To access the numeric formatting options for an axis label, expand the Axes category, expand the category of the axis to format (for example, X or Y), expand the Axis Labels category, and then select Number Formatting.
- Series data labels: To access the numeric formatting options for a series data label, you must first choose to display series data labels (see Displaying and Formatting Data Labels). Then expand the Series category, expand the Labels and Values category, and then select Number Formatting.
- In the Category pane for the number formatting options, select the option to inherit numeric formatting:
- If you are formatting values for axis labels, select Automatic. This applies the numeric formatting automatically retrieved for the graph.
- If you are formatting values for series data labels, select From Grid. This applies the numeric formatting that is shown for the object on a MicroStrategy grid report.
- Click Apply.
- Click OK.
Manually Defining the Formatting of Numeric Values
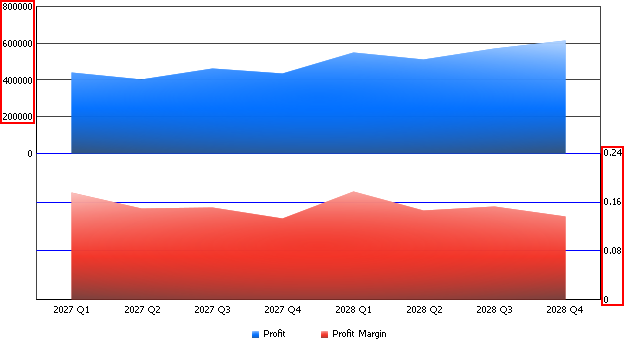
Graphs cannot always correctly inherit the formatting of metric values and other numeric values. For example, the report shown below includes metrics with two different numeric value formats.
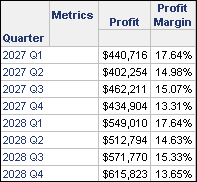
Since there is more than one numeric value format used in the grid report, the graph uses a generic numeric format by default. This is highlighted in the Area graph shown below.
While these values do not automatically represent the numeric formatting of the metric values, you can define the formatting for these values. The steps below show you how to define numeric formatting for objects on a graph.
A graph report has been created.
You are logged in to a project using MicroStrategy Developer.
To Manually Define the Formatting of Numeric Values
- Open a report in Graph View.
- Choose Graph > Graph Options.
- Browse to the Number Formatting category for the graph object that you want to define the numeric formatting for:
- Axis labels: To access the numeric formatting options for an axis label, expand the Axes category, expand the category of the axis to format (for example, X or Y), expand the Axis Labels category, and then select Number Formatting.
- Series data labels: To access the numeric formatting options for a series data label, you must first choose to display series data labels (see Displaying and Formatting Data Labels). Then expand the Series category, expand the Labels and Values category, and then select Number Formatting.
- In the Category pane for the number formatting options, select the desired numeric formatting option:
- General: Select this option to display numbers without any punctuation or other formatting symbols or syntax. This is often used as a default when a numeric format cannot be determined by default.
- Fixed: Select this option to define the number of decimal places to show, whether to include a thousands separator, and whether to use an abbreviation such as thousands, millions, or billions.
- Currency: Select this option to display number with various formatting options that reflect monetary values. You can choose from many different currency symbols, as well as how many decimal places to display.
- Date: Select this option to display numbers in a format that represents the day of the year. A list of available formats to choose from is provided.
- Time: Select this option to display numbers in a format that represents the time of day. A list of available formats to choose from is provided.
- Percent: Select this option to display numbers in a percentage format. For example, a value of .275 is displayed at 27.50% when displayed as a percent. You can also define how many decimal places to display.
- Fraction: Select this option to display numbers as fractions. A list of available formats to choose from is provided.
- Scientific: Select this option to display number in scientific notation. Scientific format displays numbers as decimal numbers, with only one digit to the left of the decimal point. E notation is used to describe the true location of the decimal point.
For example, the number 123.456 in scientific format is 1.23456E+002. The E+002 means that the decimal point's true location is two digits to the right of its scientific value position. Numbers that are less than zero use a slightly different format. For example, the number .012345 in scientific format is 1.2345E-002. The E-002 means that the decimal point's true location is two digits to the left of its scientific value position.
- Special: Select this option to choose from various numeric formatting options. Some of the special formatting options available include:
- Zip code
- Extended zip code
- Phone number
- Social security number
- Automatic or From Grid, see Inheriting the Formatting of Numeric Values.
- Click Apply.
- Click OK.