MicroStrategy ONE
Parameter Examples
Starting in MicroStrategy ONE Update 12, you can create parameters. This topic contains examples of how to use parameters.
Build More Powerful Metric Object Selectors
-
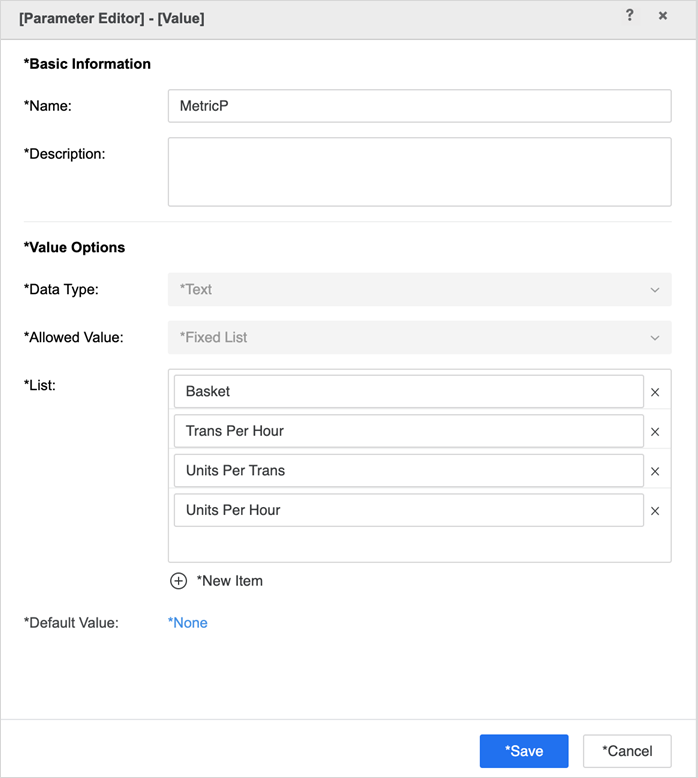
Define a value parameter named MetricP that offers a fixed list of options. This list should be populated based on the available metric objects or the options you plan to offer, as the selection is not restricted to specific metric objects, but can be an expression. Additionally, ensure that the display string of each item in the list aligns with the user's preferences.
-
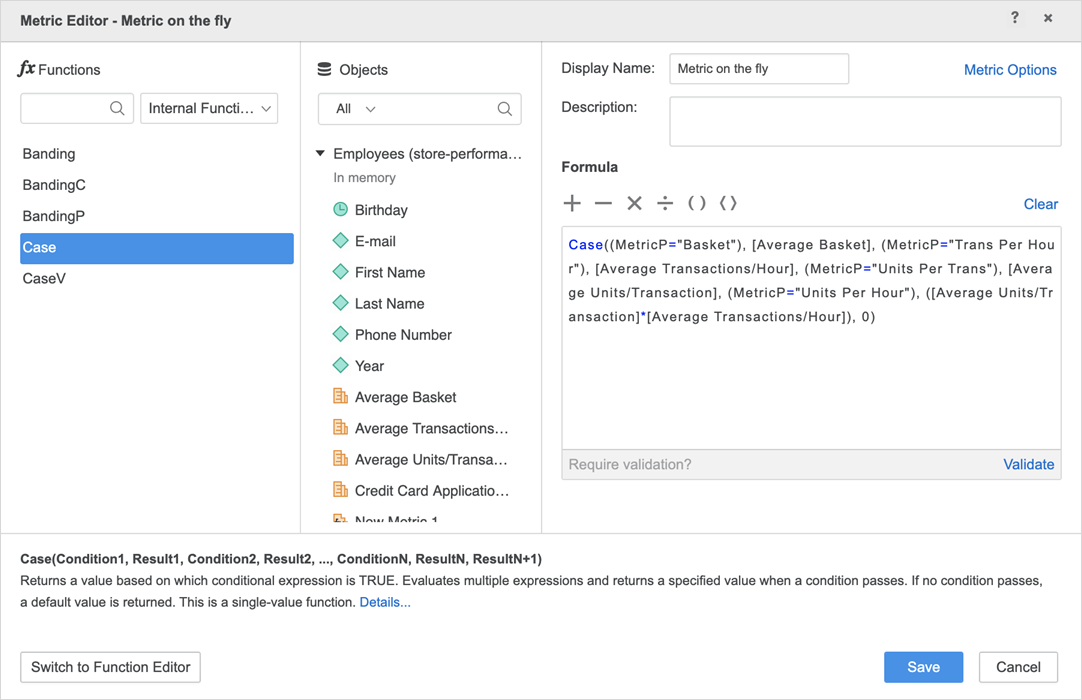
Created a derived metric with following formula. Based on user’s selection in the parameter, MicroStrategy returns different metrics or expressions.
CopyCase(
(MetricP="Basket"), [Average Basket],
(MetricP="Trans Per Hour"), [Average Transactions/Hour],
(MetricP="Units Per Trans"), [Average Units/Transaction],
(MetricP="Units Per Hour"), ([Average Units/Transaction]*[Average Transactions/Hour]),
0)
-
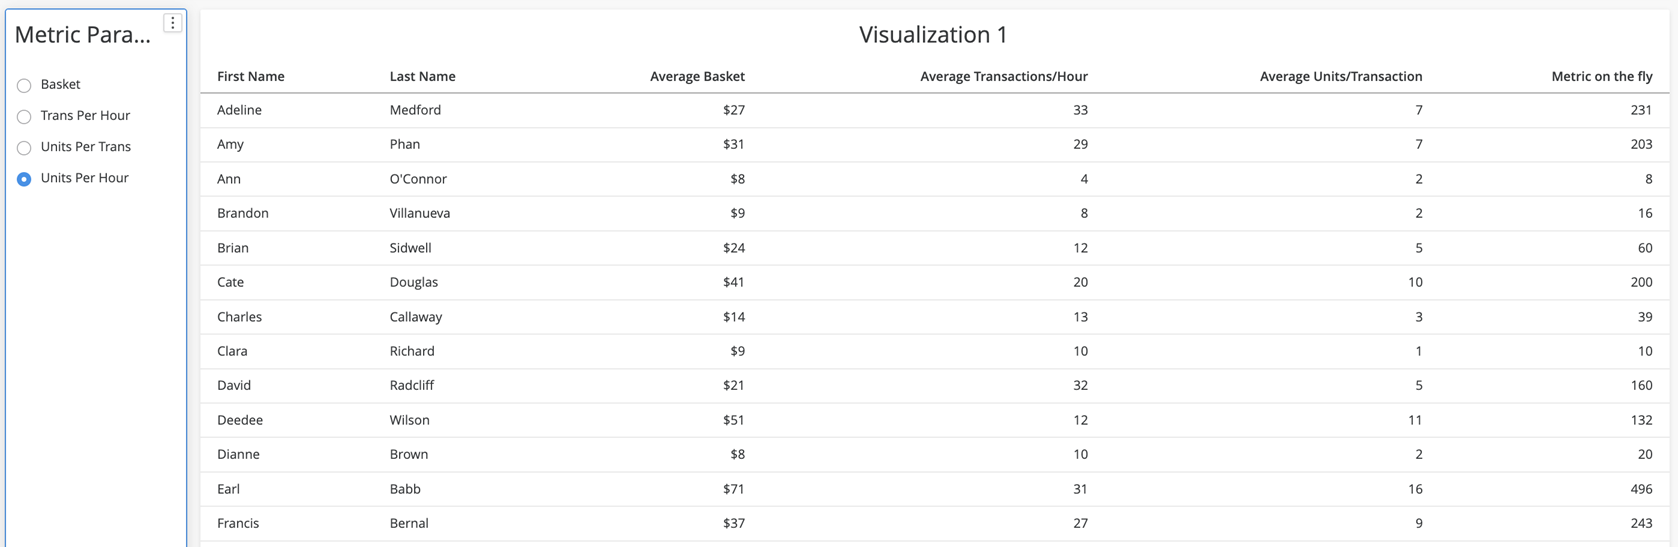
Add the derived metric into a grid or a visualization and establish a parameter selector based on the newly created MetricP parameter. Notice that this selector essentially functions as a metric object selector, but with enhanced capabilities. For instance, if MetricP = "Units Per Hour", the return value of the newly created derived metric is:
[Average Units/Transaction] *[Average Transactions/Hour]This represents the multiplication of two metrics. Note that any arithmetic expression compatible with the MicroStrategy engine can be used here.
What-If Analysis
There are multiple ways to perform a what-if analysis. One way is to create a value parameter and use it to multiply metrics, such as [Cost] * [Cost Parameter], where the cost parameter is a number between 0.5-1.5.
Check out the following what-if analysis examples below:
Sales Analysis
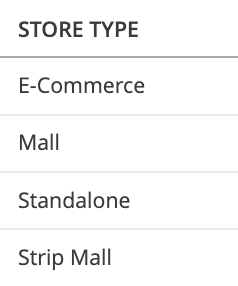
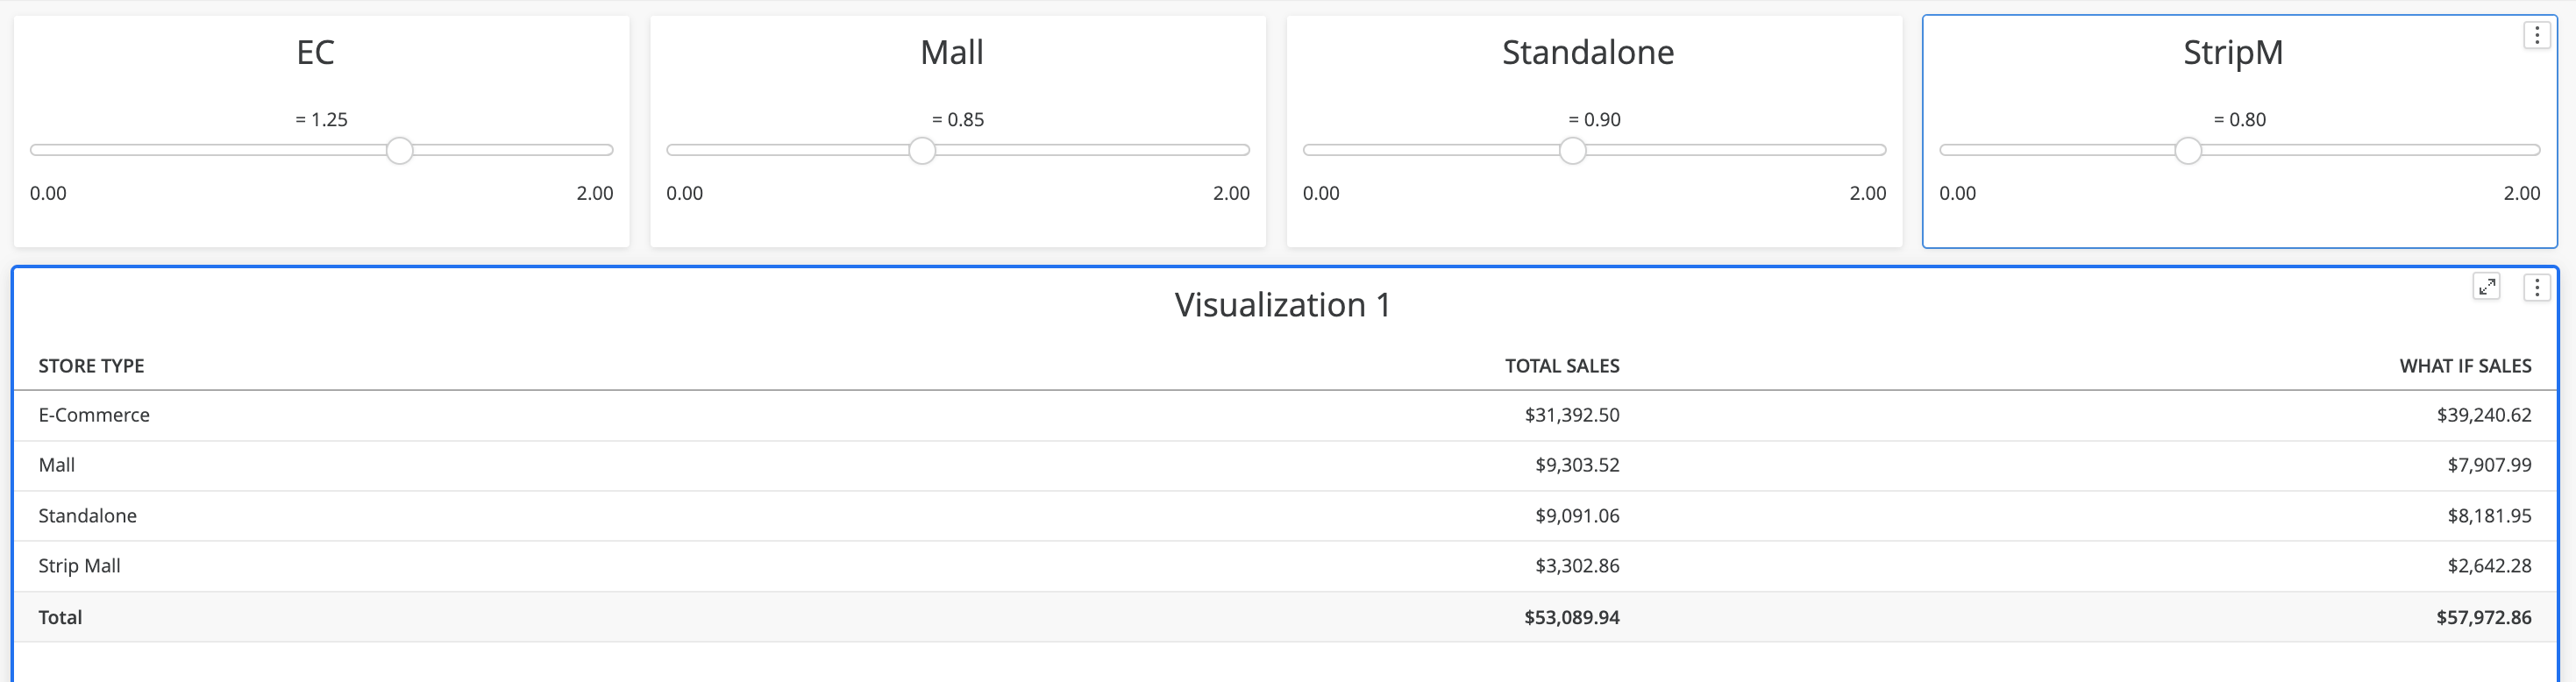
You can also add a more granular level of control to a what-if analysis. Let's perform a what-if sales analysis based on different types of sale venues: online, mall, standalone, and strip mall.
-
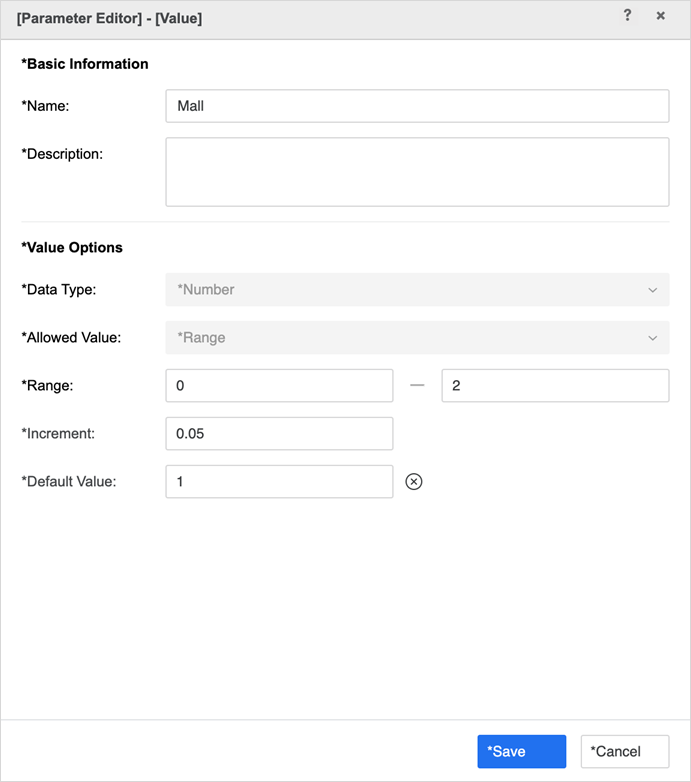
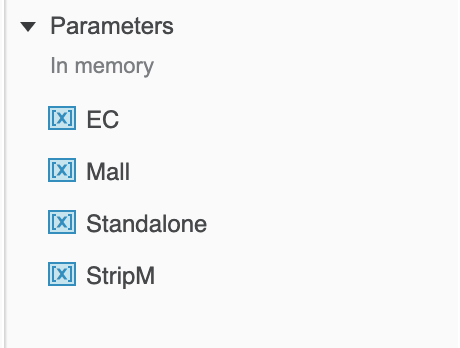
Create four value parameters, once of which looks like this:
-
Create a derived metric with a formula. If you want to calculate totals for this what-if metric, enable Metric Options > Manual > Aggregate from Base.
CopyCase(
([STORE TYPE]@ID="E-Commerce"), ([TOTAL SALES]*EC),
([STORE TYPE]@ID="Mall"), ([TOTAL SALES]*Mall),
([STORE TYPE]@ID="Standalone"), ([TOTAL SALES]*Standalone),
([STORE TYPE]@ID="Strip Mall"), ([TOTAL SALES]*StripM),
[TOTAL SALES])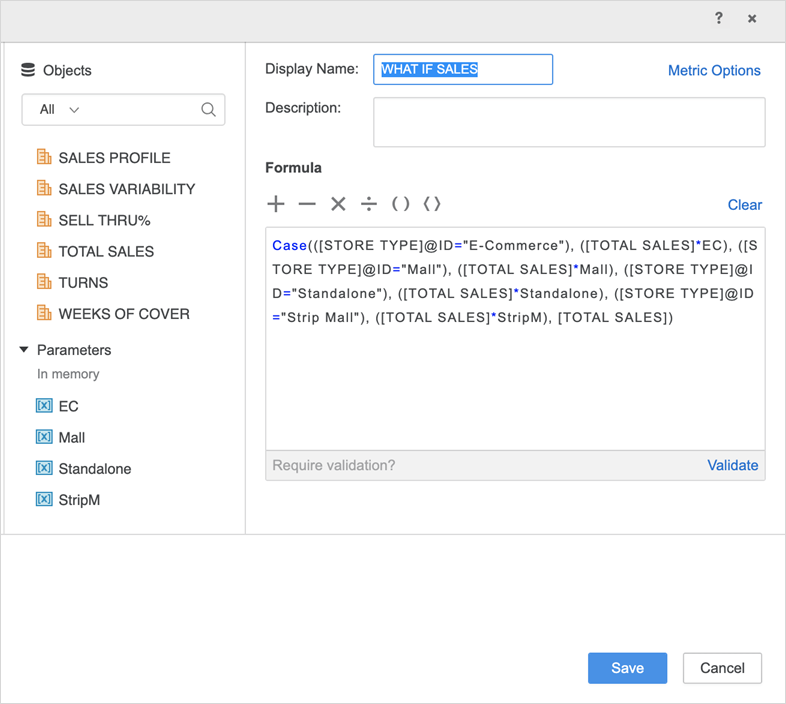
-
Establish selections for the four parameters. Then, add the what-if sales metric into a grid and start exploring your what-if analysis.
Mortgage Calculation
Let's use a mortgage calculator to show the power of using parameters in a what-if analysis.
-
Create the following parameters:
Interest Rate The annual interest rate.
Principal The principal of the loan.
Loan Term (month) The number of months in the loan term.

-
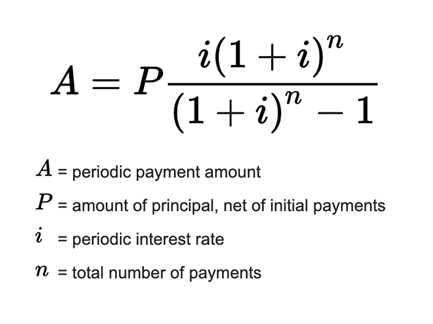
The formula to calculate a monthly payment is as follows:
-
Notice that i is not the annual interest rate, it's periodic (per month), so it is one twelfth of the annual interest rate. Use this to create a Monthly Payment derived metric.
CopyPrincipal/((Power((1+([Interest Rate]/12)), [Loan Term (Month)])-1)/(([Interest Rate]/12)*Power((1+([Interest Rate]/12)), [Loan Term (Month)])))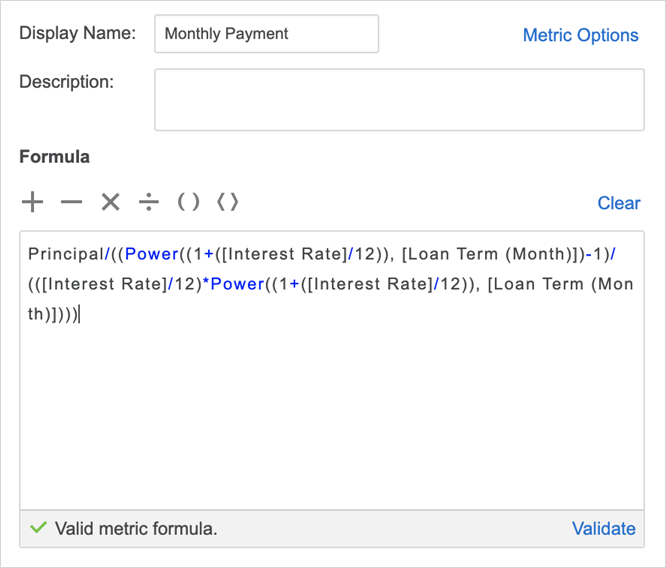
-
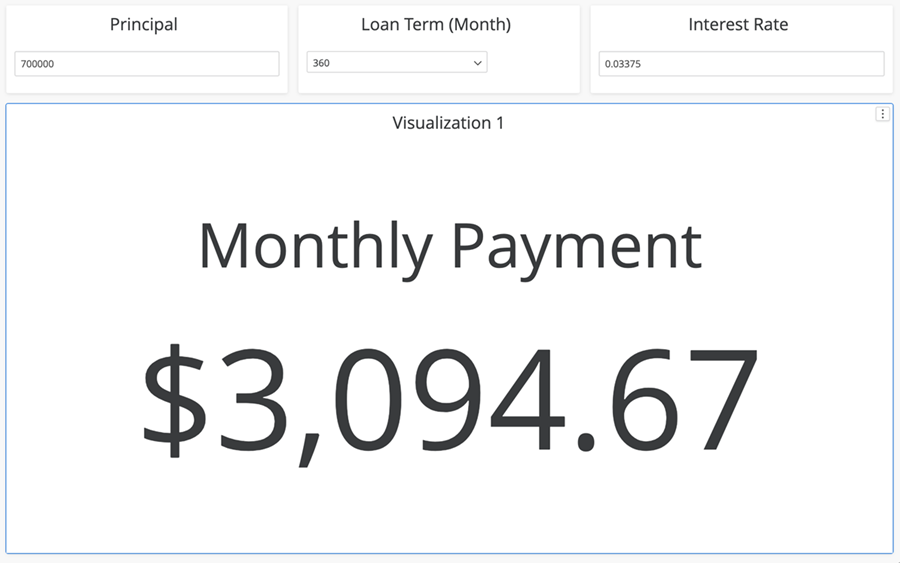
Create a KPI visualization to display the monthly payment. Users can set up the principal, loan term, and annual interest rate to calculate the monthly payment.
-
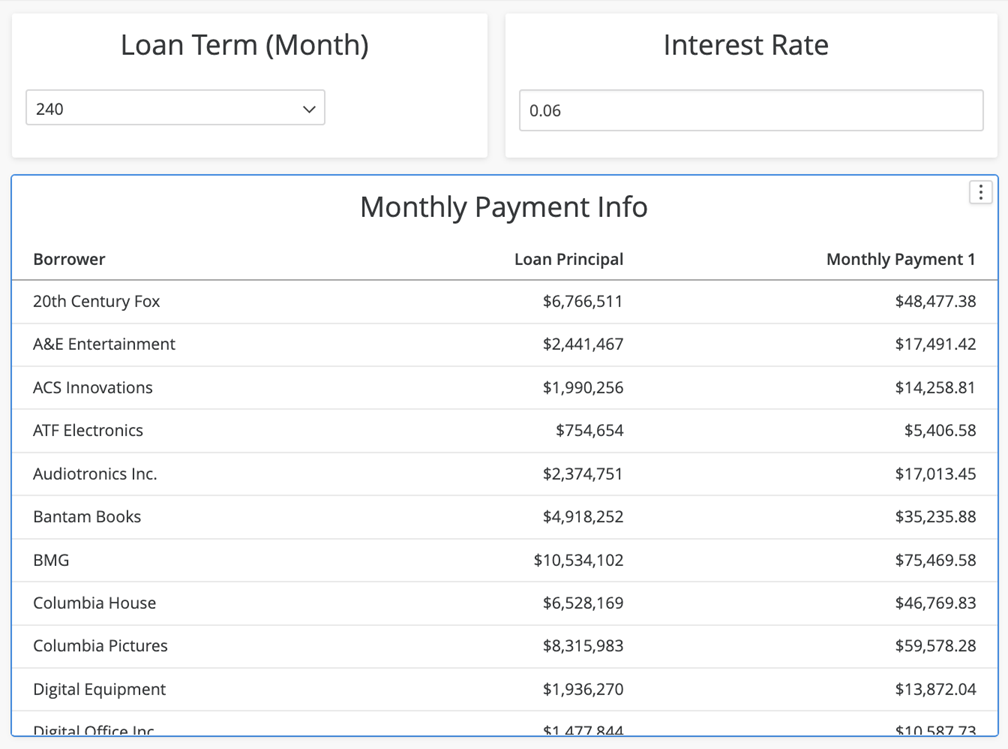
Notice the monthly payment is calculated based on parameters, while a user may also choose to use this method to calculate a monthly payment based on warehouse data. If the user has a dataset that contains loan principal information, they can create another datamart as Monthly Payment 1 using the following formula.
Copy[Loan Principal]/((Power((1+([Interest Rate]/12)), [Loan Term (Month)])-1)/(([Interest Rate]/12)*Power((1+([Interest Rate]/12)), [Loan Term (Month)])))[Loan Principal]is a metric from the dataset.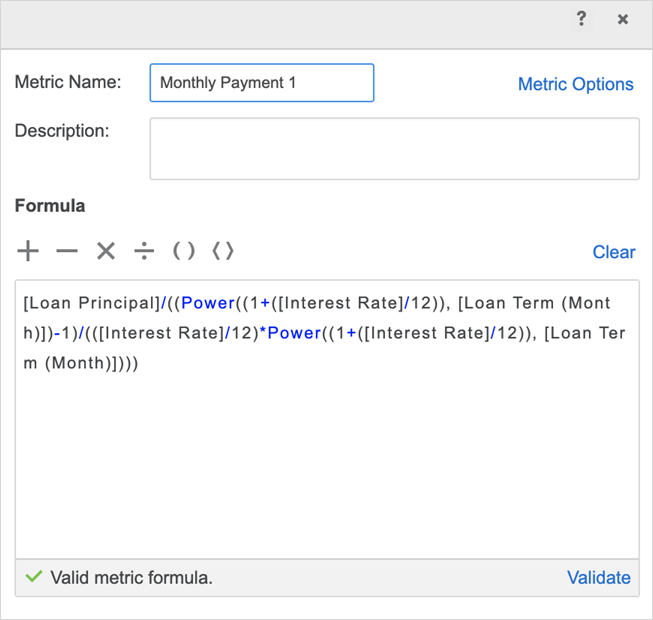
-
Users can now perform a what-if analysis, based on interest rate and loan term changes, using the loan principal data coming from the warehouse.
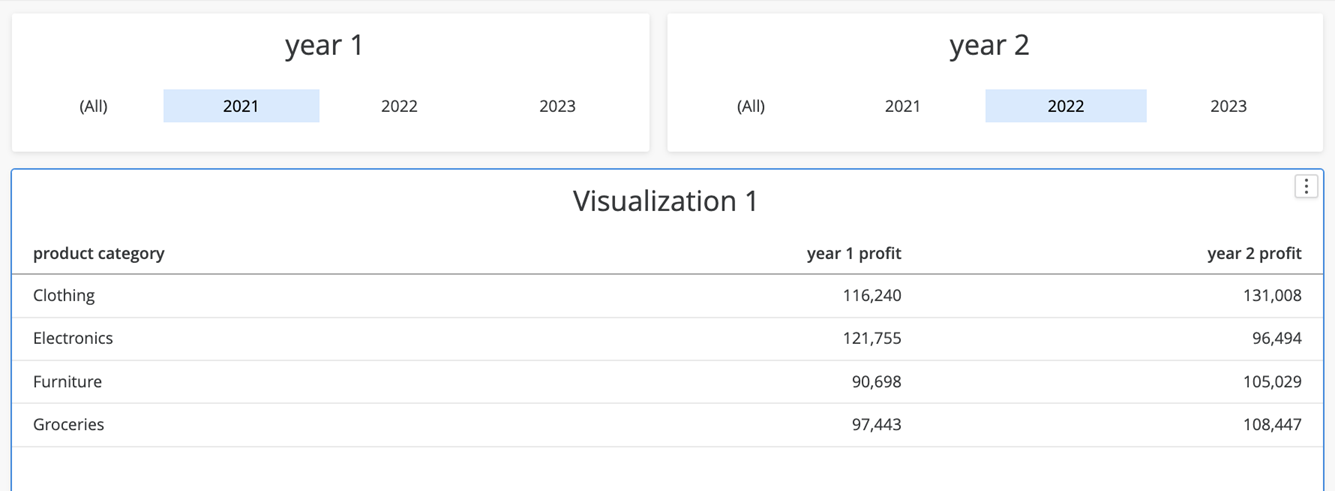
Time Transformation and Data Comparison
A parameter selector can be finely tuned to affect only the value of a particular conditional metric. This precision allows a selector to modify the value in just one metric column within a grid, rather than impacting the entire grid. This targeted functionality makes it straightforward for users to perform tasks like time transformations and data comparisons.
-
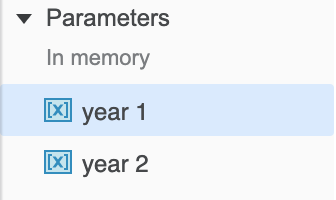
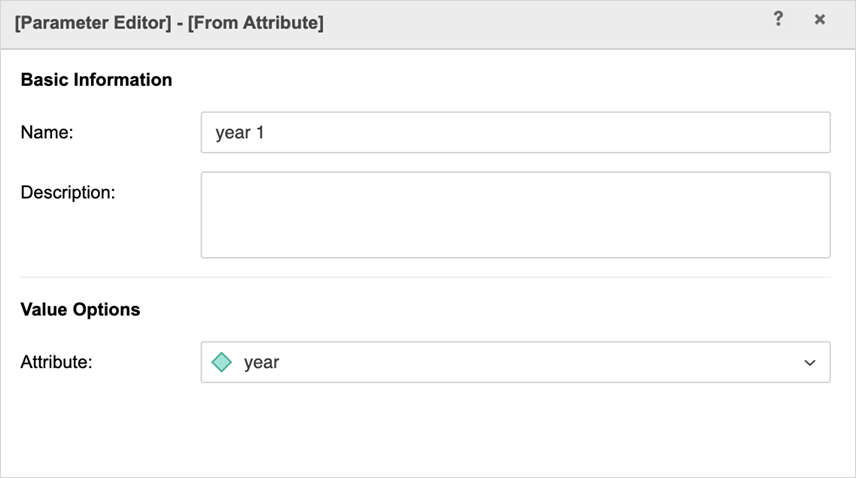
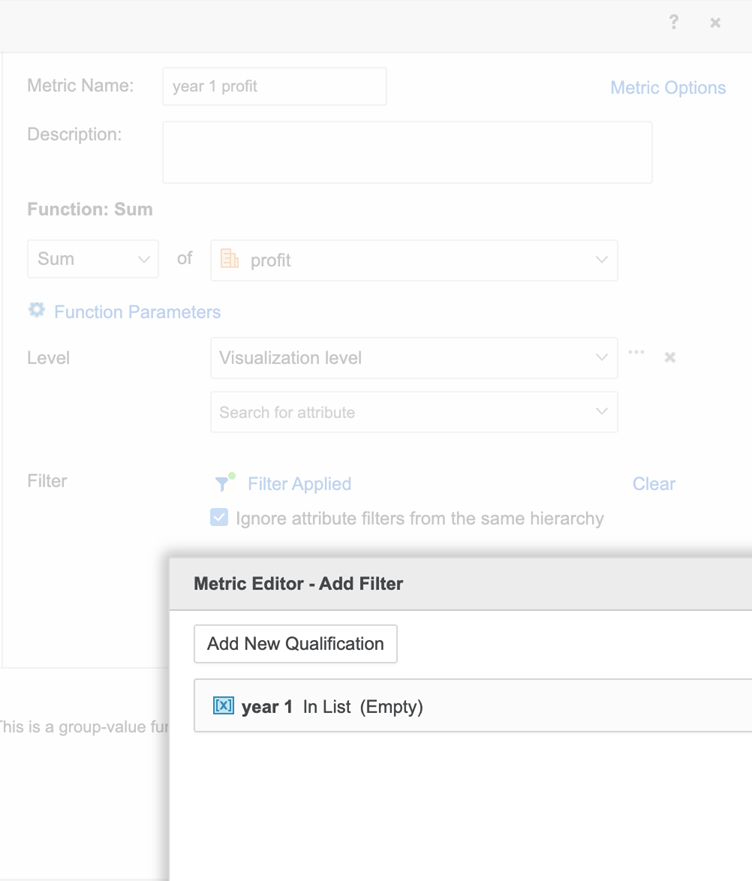
Create two element list parameters, based on a Year attribute, named year 1 and year 2.
-
Create two derived metrics. In each derived metric's condition, add one of the parameters.
-
Add the derived metrics to a grid, along with two parameter selectors for year 1 and year 2, setting them to single selection only. Now you can do a side-by-side profit comparison of any two years.