MicroStrategy ONE
Create a Bubble or Scatter Chart
You can create a bubble or scatter chart.
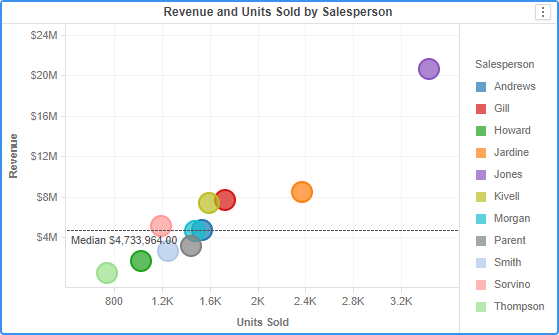
A bubble chart requires at least one attribute and one metric. The markers are not sized and do not overlap. Click here to see an example bubble chart below.
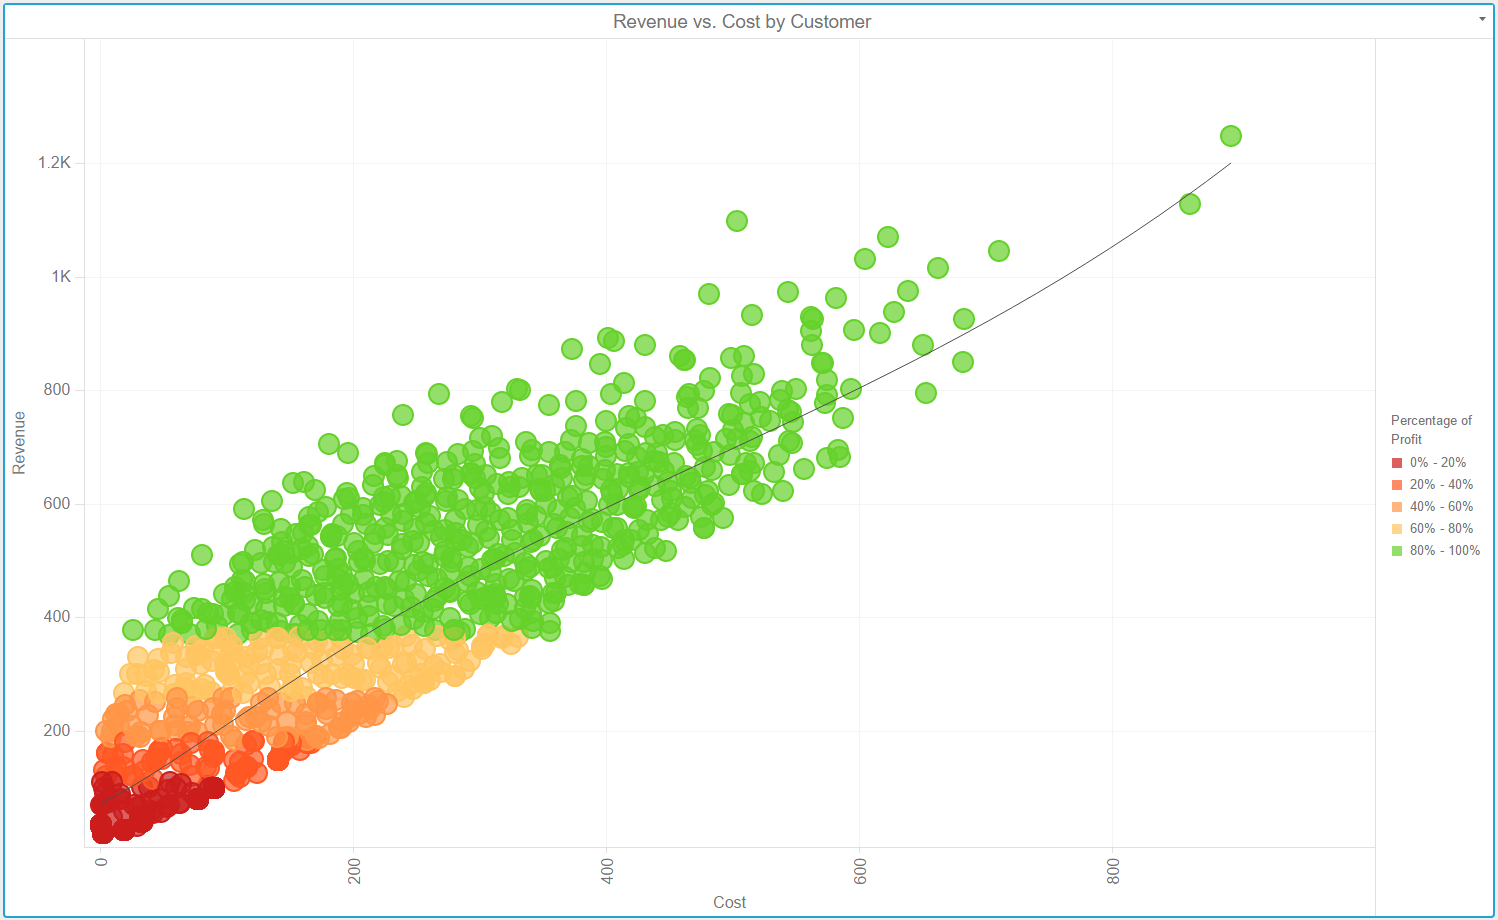
A scatter chart requires two or metrics that are plotted on at least two connected axes. Markers on a scatter chart can overlap. You size and/or color the markers using a metric. Click here to see an example scatter chart below.
- Open a dashboard.
- In the top toolbar, click Insert Visualization
 .
. - Choose More > Bubble Chart
 .
. - In the Datasets panel, double-click attributes and metrics to add them to the visualization.
Example Bubble Chart
Example Scatter Chart