MicroStrategy ONE
Filter Data in Your Dashboard
You can simultaneously filter all visualizations in a chapter, to view only the information that you require. A chapter is a layer of data, with its own filtering criteria. Each chapter is represented by an entry in the contents. When you select values in a filter, the data updates in all visualizations and any dataset objects that appear in text fields on the chapter.
To filter data in a dashboard:
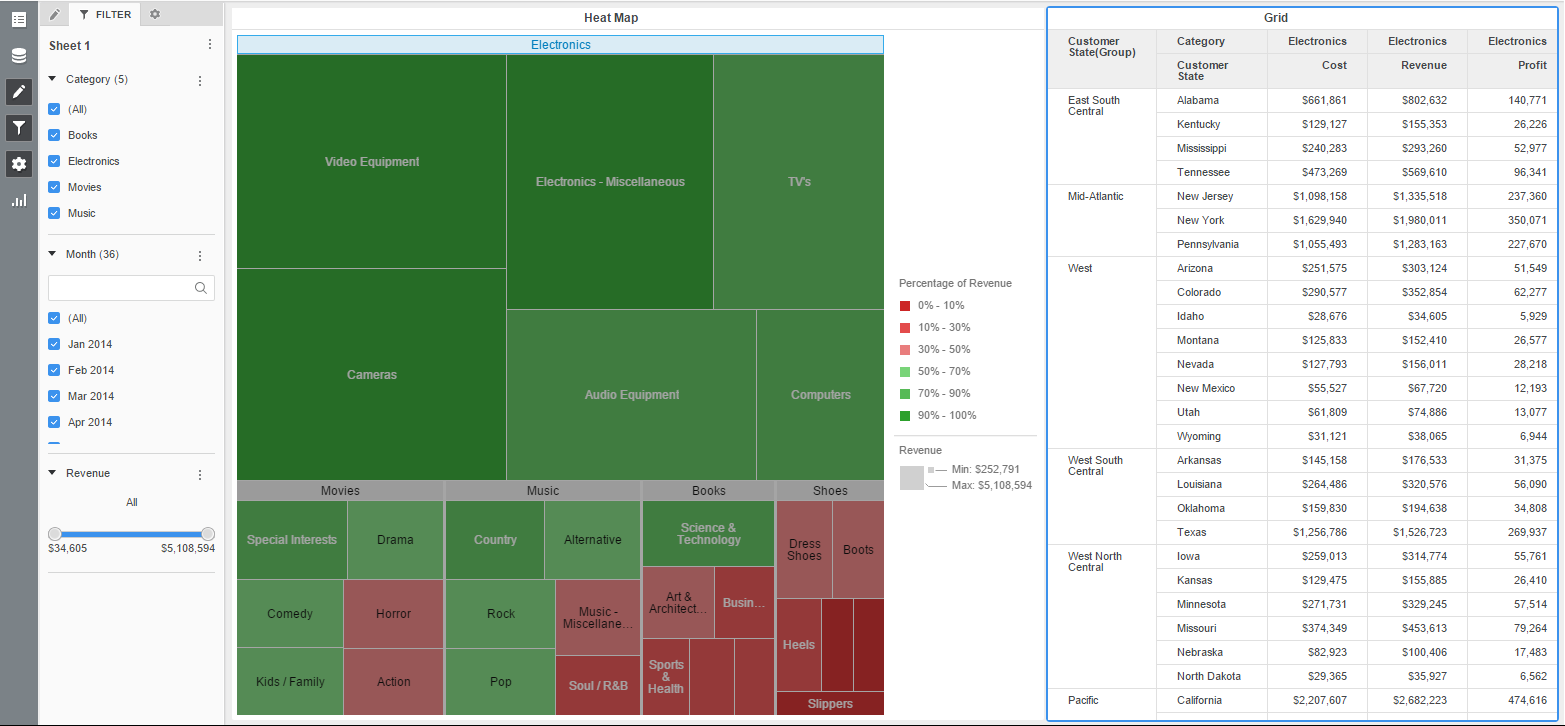
- Open the dashboard with the heat map visualization you modified in Allow a Visualization to Update the Data in Another Visualization.
- Open the Filter panel.
- Make the appropriate filter selections. If a filter is collapsed, select the expansion arrow to the left of the filter name to expand it. See Filter Display Styles for more information about how to use each filter style.