MicroStrategy ONE
Create a Bar Chart
- Open a dashboard.
- In the top toolbar, click Insert Visualization
 .
. - Choose Bar and one of the many bar chart options. A bar chart requires at least one attribute and one metric.
- In the Datasets panel, double-click attributes and metrics to add them to the visualization.
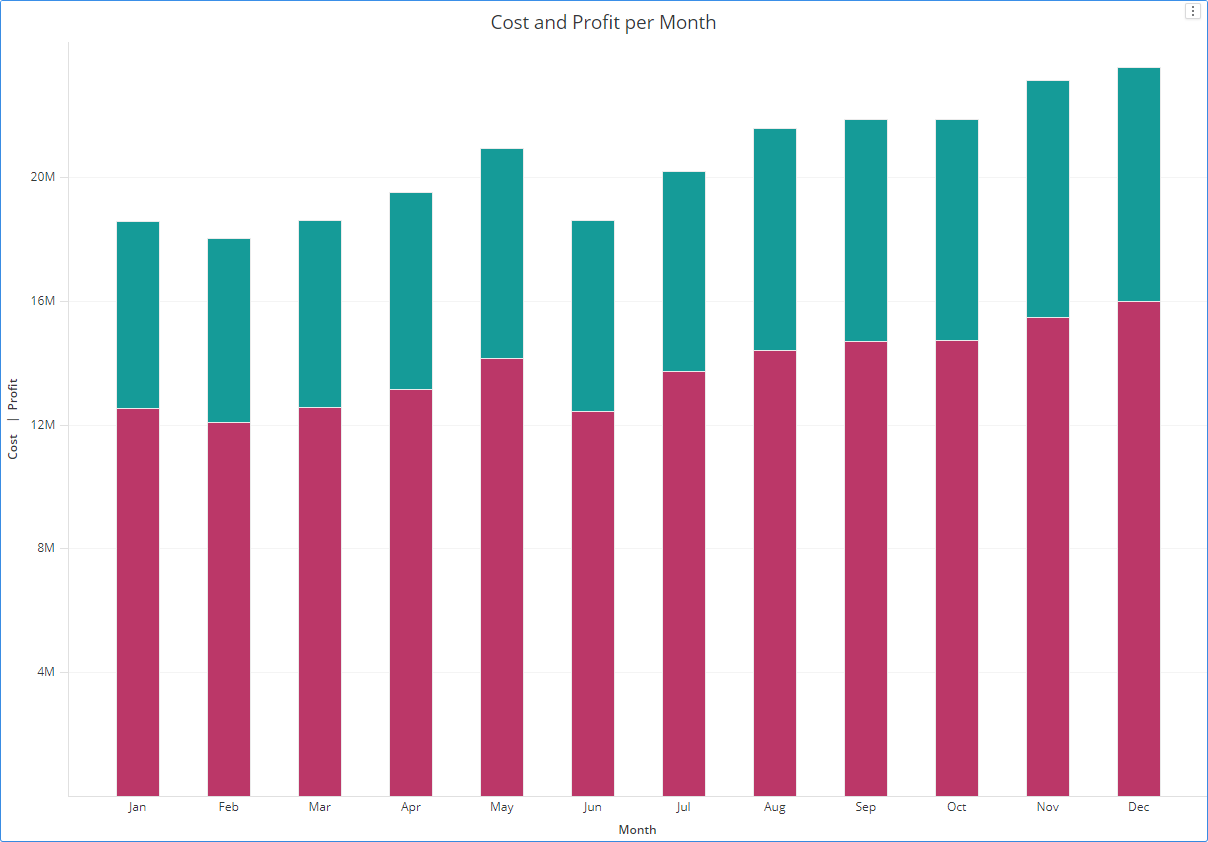
Example Vertical Stacked Bar Chart
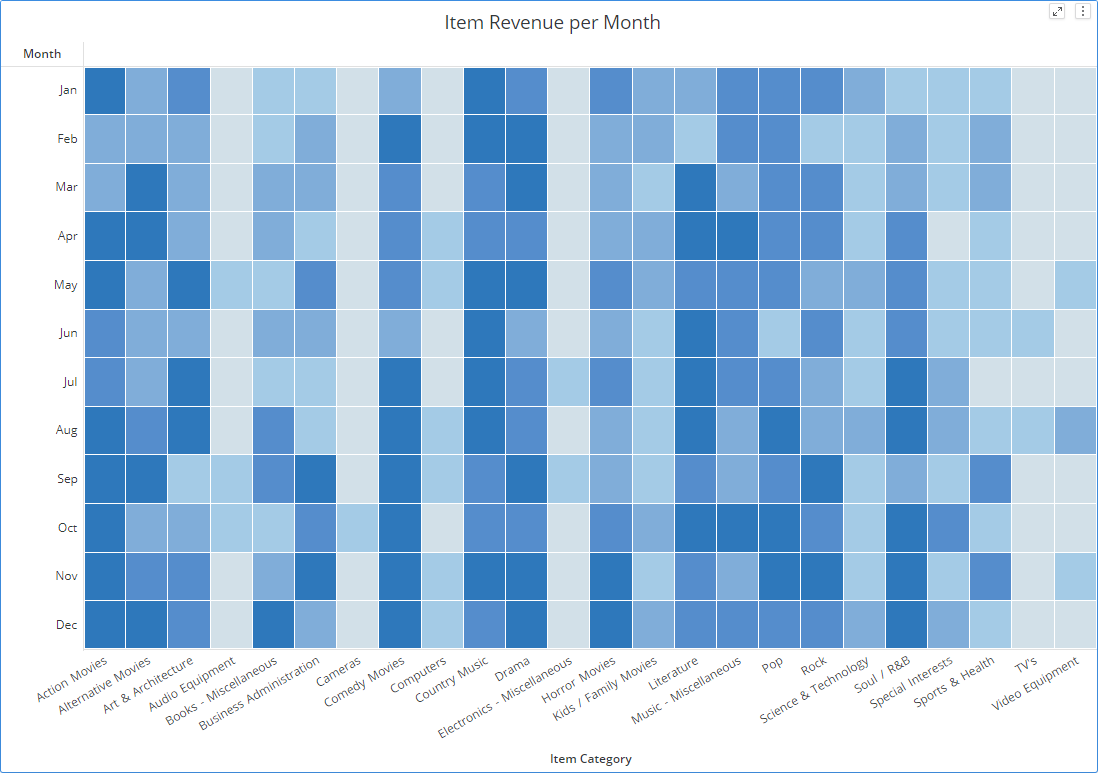
Example Matrix Bar Chart
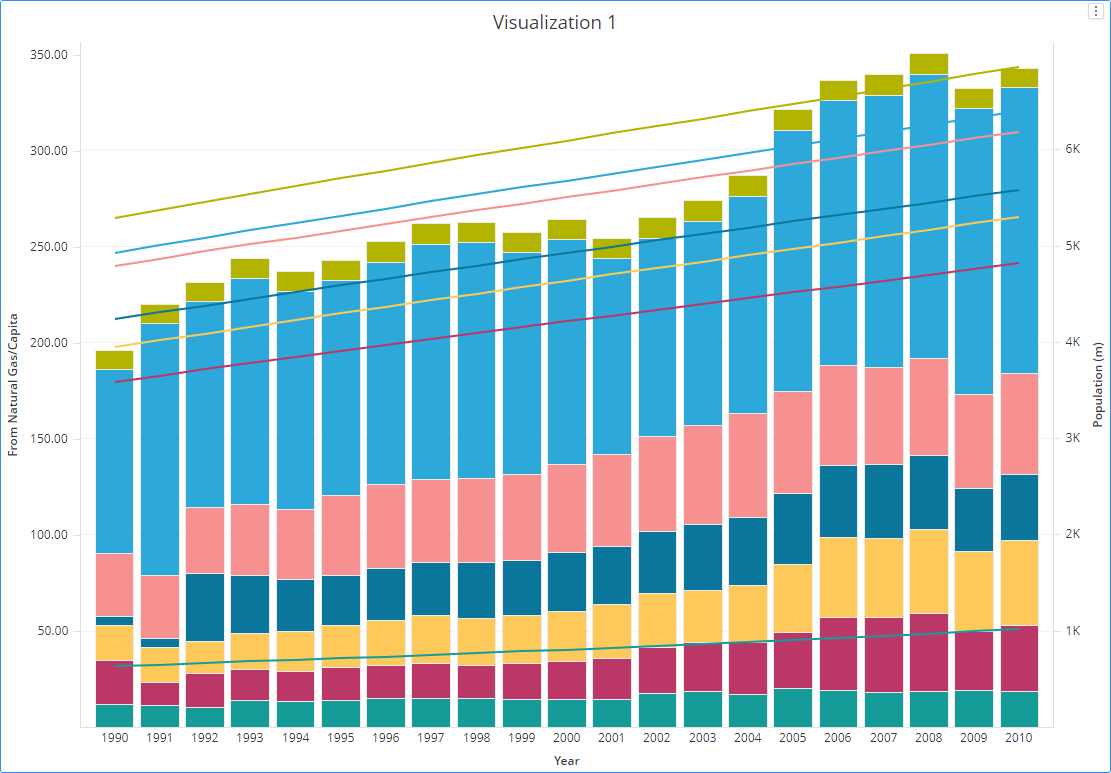
Example Combo Chart